Market Report: Decoding On-Chain Capital Flows, Tokenomics Pitfalls & AI-Automated Research Frameworks
Market Report: Decoding On-Chain Capital Flows, Tokenomics Pitfalls & AI-Automated Research Frameworks
A comprehensive dissection of information asymmetry, high-frequency algorithmic liquidity hunts, fatal tokenomics design flaws, and building a 30-minute automated morning research routine.
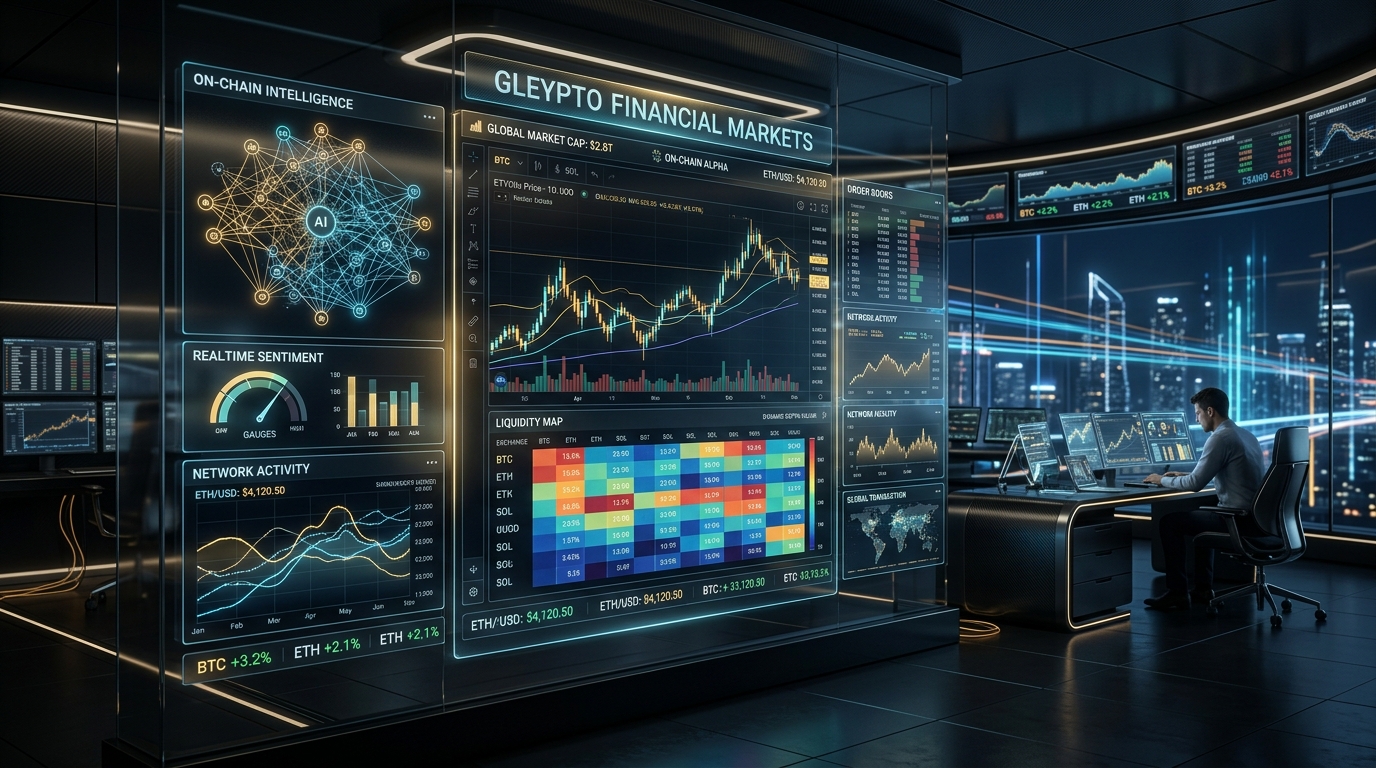
The Macro Picture: The Harsh Reality of Information Asymmetry in Financial Markets
Global financial markets and digital asset sectors operate under severe profit distribution dynamics. While millions of retail traders rely on lagging technical indicators and delayed mainstream news, quantitative hedge funds, institutional market makers, and top-tier financial entities leverage superior technological infrastructure.
Institutions make decisions based on rigorous mathematical probability models. They hold direct access to micro-level order book feeds, real-time on-chain liquidity data, and artificial intelligence algorithms capable of computing millions of volatile market scenarios instantaneously.
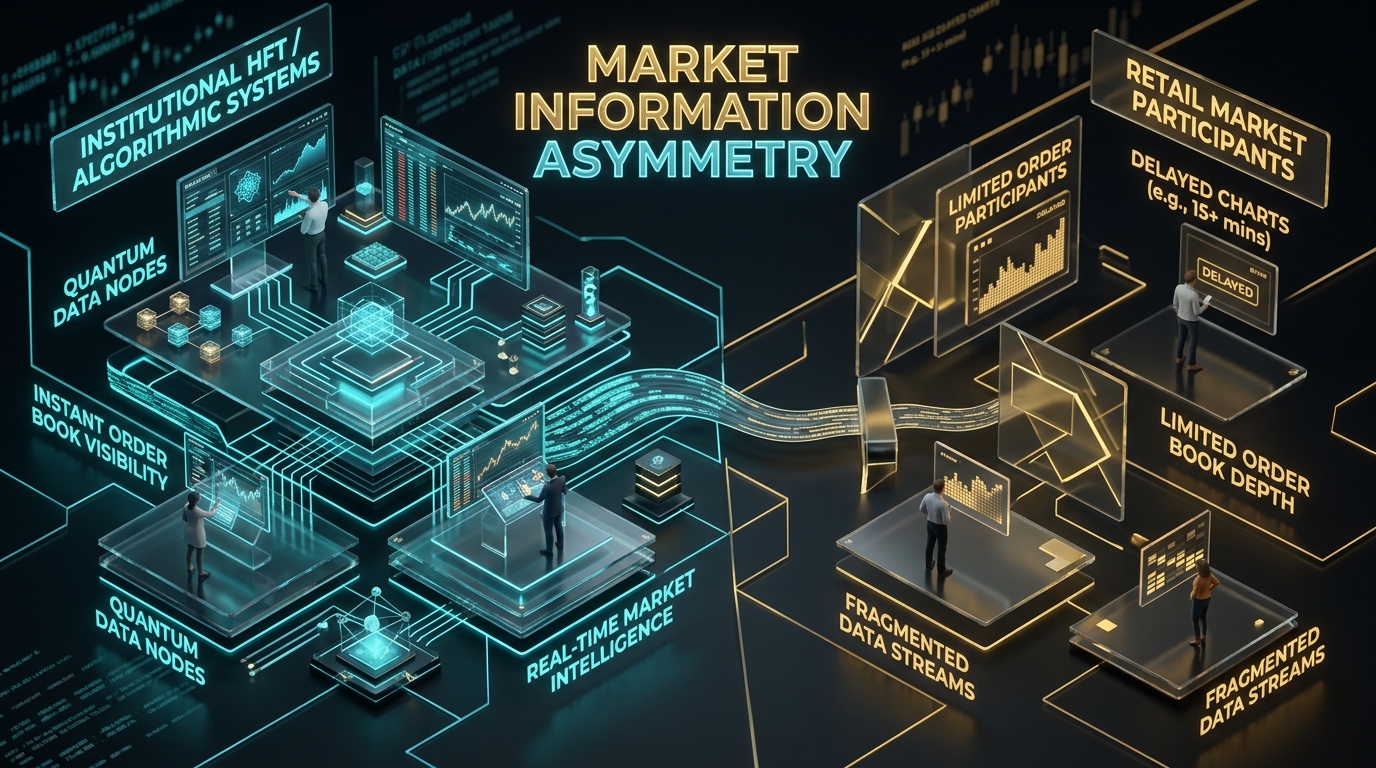
This information asymmetry manifests distinctly across four critical dimensions:
Macroeconomic data and major wallet movements are processed by institutions via high-frequency algorithms in milliseconds. Retail investors typically access this information hours or days later after price ranges have already completed accumulation or distribution.
Institutions monitor whale wallet clusters, deep order-book liquidity dynamics, and on-chain capital flows. Retail traders often depend solely on lagging candlestick charts on lower timeframes filled with random market noise.
Large institutions employ deep learning neural networks to quantify standard deviations, multi-asset correlations, and liquidity exhaustion. Retail traders mostly draw manual lines across individual standalone charts.
Institutions operate entirely via automated algorithmic frameworks, systematically exploiting human emotional biases to trigger large-scale liquidations at key support and resistance levels.
To comprehend the scale of asymmetry, observe how quantitative hedge fund algorithms operate. An average fund processes hundreds of thousands of data packets per second, detecting micro-shifts in order depth and analyzing sentiment across thousands of channels using large language models. When pivotal news like inflation prints or interest rate decisions hit, these algorithms execute multi-million dollar portfolio rebalancings before an individual can even open a web browser.
This erects an invisible yet formidable barrier for retail participants. Attempting to compete on speed or front-run news places retail traders at an immediate structural disadvantage. Acknowledging this reality allows traders to abandon illusions of speed competition and focus on leveraging flexibility and structural patience.
Recognizing this asymmetry clarifies that emotional guessing and speed races lead to heavy drawdowns. The sustainable solution is building an intelligent observation ecosystem powered by objective quantitative data.
Decoding the On-Chain Flow Matrix: How Institutions & Market Makers Coordinate
Unlike traditional financial systems where institutional order flows remain concealed behind quarterly filings, blockchain technology provides an open ledger. However, extracting actionable signals requires advanced parsing to distinguish authentic accumulation from artificial wash trading.

A complete institutional Smart Money cycle traverses four distinct stages:
-
Stage 1: Stealth Accumulation
Sustained net outflows move from centralized exchanges into distributed cold storage wallets. Public trading volume remains suppressed and price ranges contract to accumulate maximum inventory without inflating institutional cost basis.
-
Stage 2: Liquidity Test
Institutions execute rapid price probes past technical support or resistance levels to absorb panic sell volume from over-leveraged positions, priming supply for markup.
-
Stage 3: Markup Phase
Once liquid floating supply is depleted, aggressive upward price expansion is triggered. This phase is paired with optimistic media narratives to attract fresh market liquidity.
-
Stage 4: Distribution Phase
Institutions transfer assets back to exchanges via granular transactions, absorbing euphoric retail buying liquidity to securely exit large initial positions.
Among the most critical on-chain metrics is Net Unrealized Profit/Loss (NUPL) combined with Coin Days Destroyed (CDD). When dormant coins (held for over 1 year) exhibit sharp exchange inflows during peak euphoric phases, it provides clear empirical evidence of institutional distribution.
Conversely, during periods of extreme despair and fear, exchange reserves decline steadily while accumulation addresses surge. This represents the phase where institutional market makers patiently build inventory at deep discounts. Mastering capital flow cycles aligns retail investors alongside Smart Money rather than serving as exit liquidity.
Tracking capital flows demands synthesized monitoring across long-term net outflow volume, whale address concentration ratios, and derivatives open interest liquidity shifts.
Red Teaming Tokenomics: Decoding Fatal Flaws & Sophisticated Distribution Models
In modern tokenomics engineering, the High Fully Diluted Valuation (High FDV) with Low Initial Circulating Supply (Low Float) architecture poses immense structural risks for long-term holders, shifting liquidity risks onto secondary market participants.
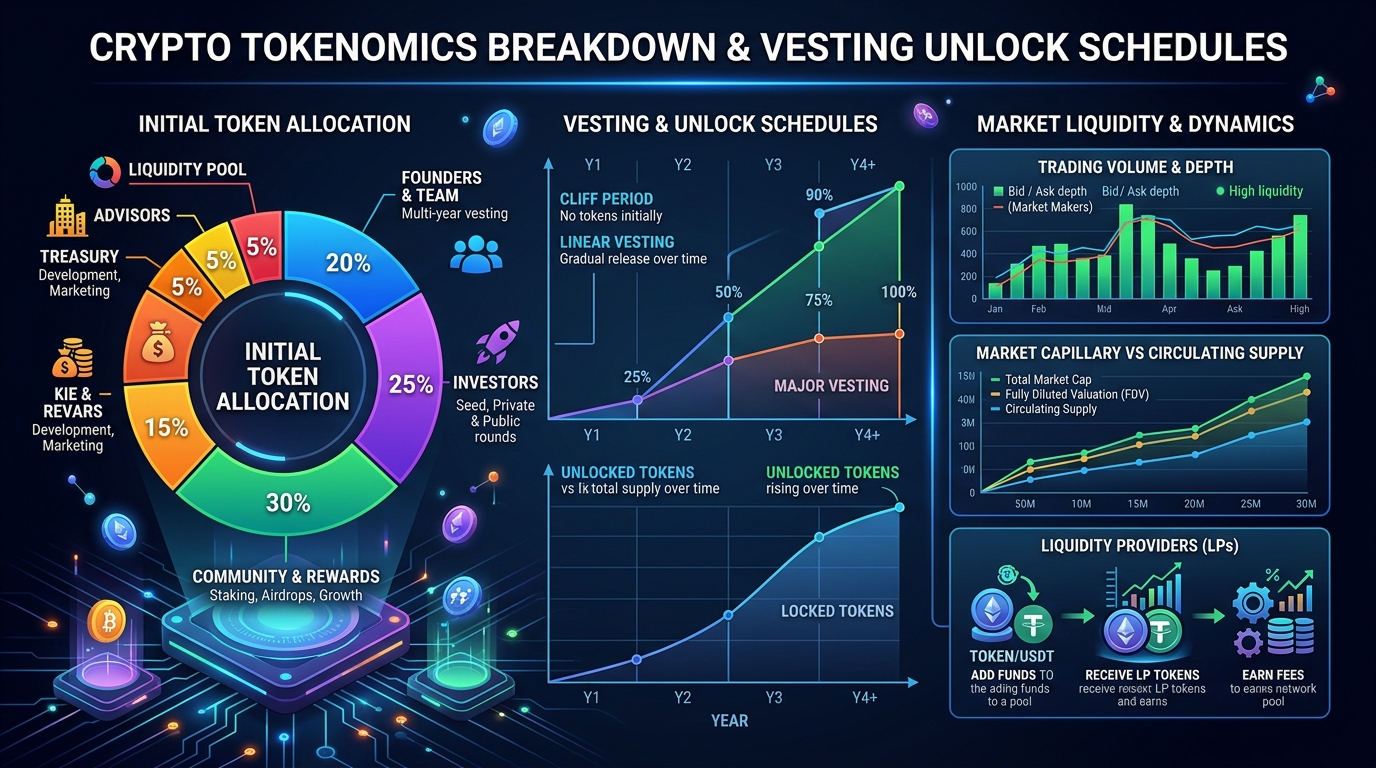
A rigorous multi-dimensional Red Teaming audit exposes four fatal vulnerabilities:
Projects launch with an initial circulating market cap of $50M against a multi-billion dollar FDV. Artificial supply scarcity triggers rapid initial price appreciation, but massive incoming unlock schedules generate chronic sell pressure over subsequent years.
When initial cliff periods expire, massive seed-round allocations unlock simultaneously. Profit-taking pressure overwhelms natural market depth, resulting in prolonged price decay.
Exorbitant nominal staking APYs generate an illusion of quick yield. As new token emissions flood the system without organic protocol revenue backing, unit purchasing power depreciates steadily.
Development entities gradually siphon backing assets from automated liquidity pools, causing extreme slippage and trapping retail capital with illiquid exit routes.
A classic case study in tokenomics design traps involves infrastructure protocols raising funds at billion-dollar valuations early on. At listing, only 3% to 5% of total supply enters circulation, creating artificial scarcity. Because the floating supply is minimal, modest buying volume easily sparks aggressive parabolic runs amplified across media.
However, once monthly vesting schedules activate after 6 to 12 months, newly unlocked tokens dwarf daily organic buying volume. Consequently, asset prices endure sustained multi-year downtrends regardless of technical milestones. Prudent analysts must quantify annual inflation rates and compare real protocol revenue growth against circulating supply expansion.
Investors must prioritize projects exhibiting transparent treasury allocations, circulating supply ratios above 30%, and linear long-term vesting schedules.
Liquidity Traps & The Art of Stop-Hunting by High-Frequency Algorithms (HFT)
Obvious technical support and resistance levels house dense concentrations of retail stop-loss orders. High-frequency quantitative algorithms (HFT) systematically target these zones as primary Liquidity Pools to absorb discounted inventory.
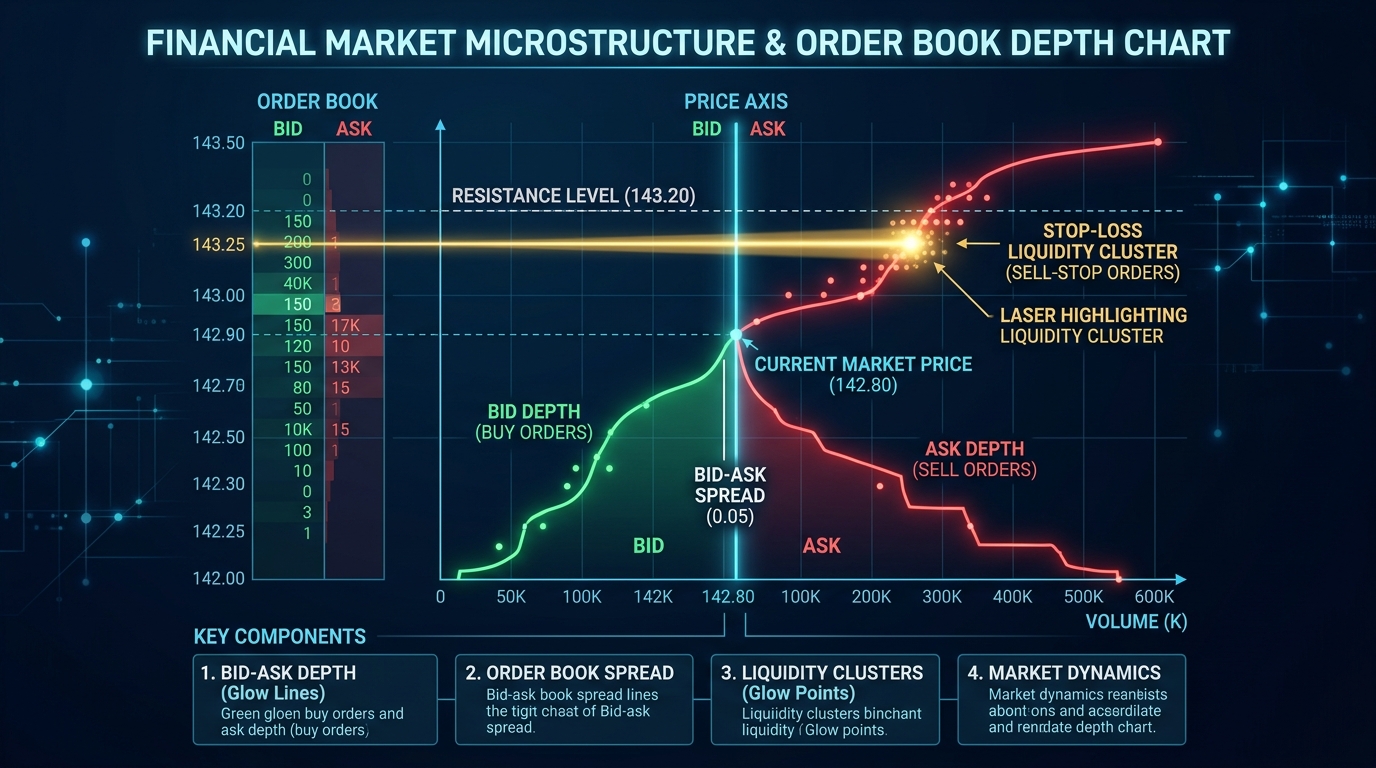
Standard liquidity sweeps execute through a structured 3-step sequence:
- Liquidity Sweep Execution: Momentarily driving prices beyond key support or resistance levels to trigger cascading stop orders and induce short-term panic.
- Counterpart Absorption: Filling massive limit orders at extreme pricing deviations from fair value to accumulate inventory at optimal pricing.
- Candle Rejection & Level Reclaim: Prices quickly wick back within range boundaries, forming clear reversal pin-bars confirming institutional sponsorship.
To identify liquidity traps, traders must examine price action at previous session highs and lows. When price surges past prior highs with heavy volume but leaves a long upper wick closing below resistance, it demonstrates a classic False Breakout or Swing Failure Pattern (SFP).
This occurs because institutional players use the breakout buying frenzy to absorb their profit-taking sells or initiate large short positions. By waiting for candle closes confirming rejection rather than chasing breakout momentum, traders insulate themselves from expensive traps.
The Fatal Flaw of Manual Methods: Why Staring at Screens for 12 Hours Always Fails
Many traders monitor charts for 10 to 14 hours daily attempting to catch every micro fluctuation. However, neurocognitive research demonstrates that continuous exposure to short-term price volatility drastically impairs decision-making quality and amplifies mental stress.
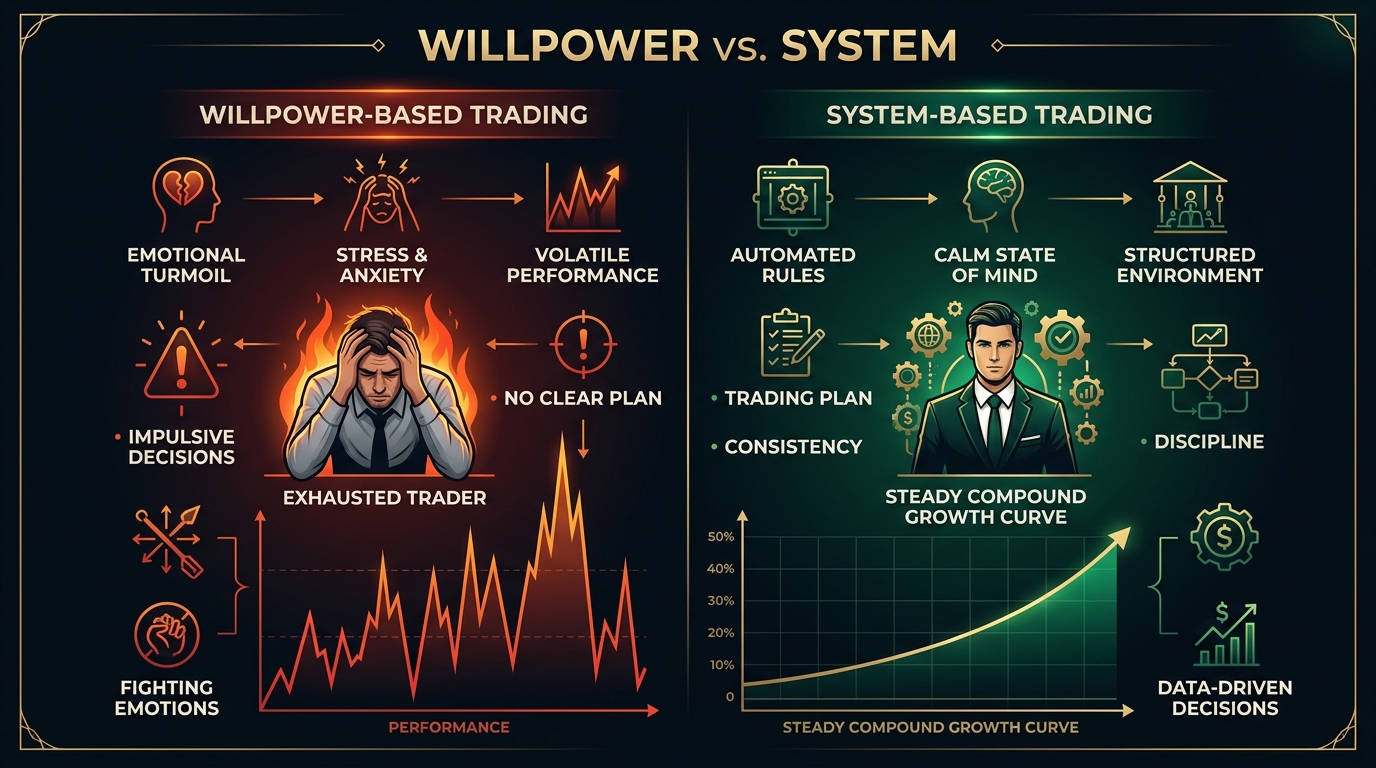
Three biological bottlenecks include:
Every trade evaluation depletes prefrontal cortex resources. After hours of intense screen exposure, emotional discipline erodes, resulting in impulsive rule violations.
The urge for constant action tricks traders into seeing valid technical signals within random noise, multiplying transaction costs and unnecessary losses.
Attempting immediate recovery after a loss leads to aggressive position doubling and catastrophic violations of predefined portfolio risk parameters.
Analysis paralysis is another frequent byproduct of screen overexposure. Staring at dozens of conflicting indicators across 1-minute to 15-minute charts generates sensory overload, where momentum oscillators show overbought conditions while trend indicators signal continuation.
This constant conflict triggers anxiety and self-doubt. Traders either freeze and miss high-conviction setups or enter impulsive trades to relieve restlessness. Streamlining your workspace and applying strict quantitative screening criteria restores mental clarity and composure.
Delegating market surveillance to automated systems is essential for preserving mental energy and focusing on high-level strategic allocation.
AI Automated Scanning Architecture: A 30-Minute Morning Routine
Modern trading shifts focus from manual observation to system governance: delegating multi-timeframe surveillance to AI while dedicating just 30 focused minutes each morning to evaluate high-probability setups.
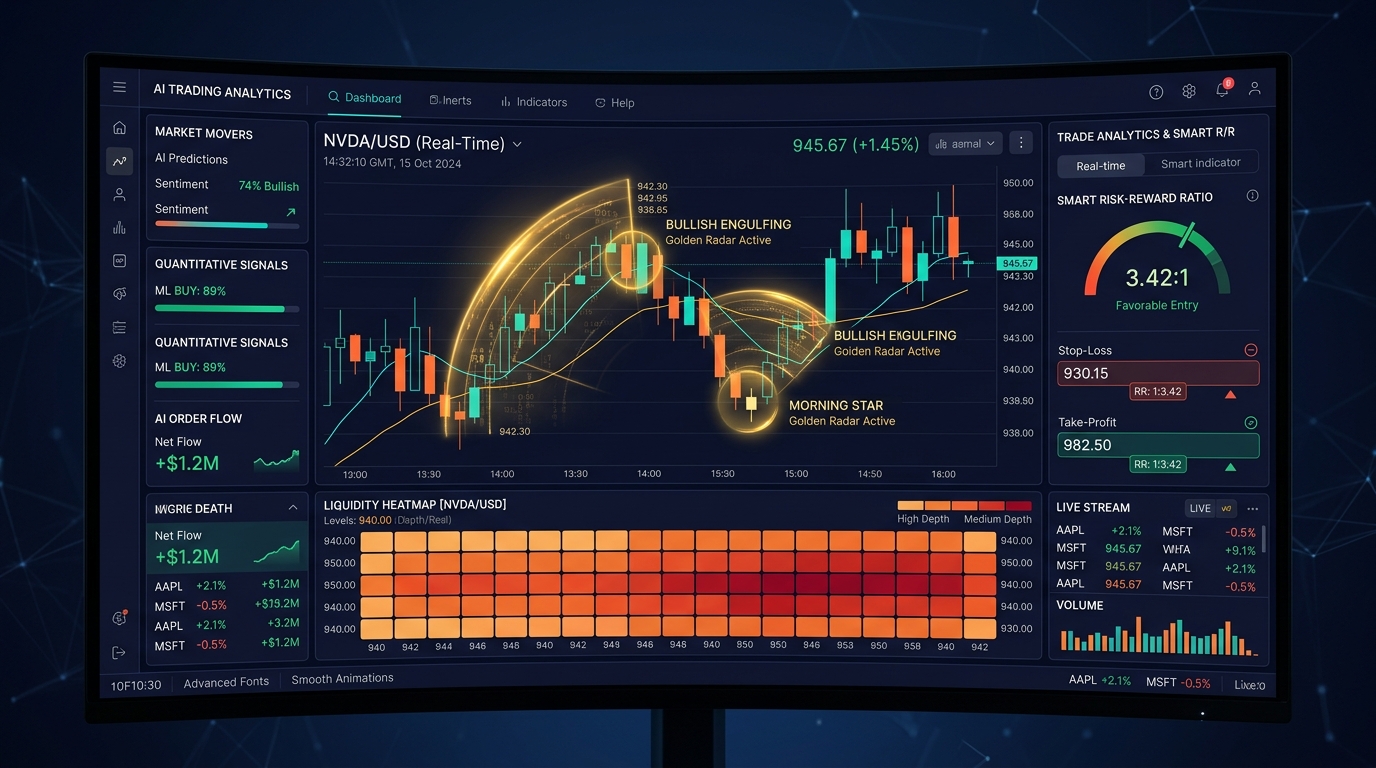
The standardized 30-minute morning routine follows a strict 4-step framework:
Minutes 0 - 10: Review Synthesized Signals
Open the AI Scanner synthesized dashboard. The engine has pre-screened over 200 asset pairs across macro timeframes, filtering for tight liquidity compression and volume convergence.
Minutes 10 - 20: Confirm Volume & Capital Flow
Cross-reference detected chart patterns against volume delta divergences and on-chain net flows to validate setup authenticity before formulating trade plans.
Minutes 20 - 25: Set Alerts & Sizing Parameters
Calculate fixed risk position sizing capped at 1% of total portfolio. Deploy automated price alerts at technical trigger levels and close active chart software.
Minutes 25 - 30: Log Journal & Close Session
Archive setup metrics into the digital trade journal and conclude the session, stepping into the day with clarity and emotional tranquility.
A decisive advantage of AI-automated scanning is unyielding consistency. Algorithms never suffer from sleep deprivation, never experience FOMO during vertical green candles, and never hesitate on stop-loss execution. They scan markets purely based on rigorously backtested mathematical rules.
Upon receiving screened opportunities from the intelligent scanner, the trader transforms from a stressed chart-hunter into a calm risk manager. You simply audit the macro context, calculate appropriate sizing, and set conditional orders—keeping execution disciplined and your energy protected.
Multi-Timeframe Framework & The 4-Layer High-Probability Filter
Multi-timeframe analysis protects traders from lower-timeframe traps. Reversal setups on intraday charts must align with higher-timeframe macro structures to ensure high reward-to-risk asymmetry.
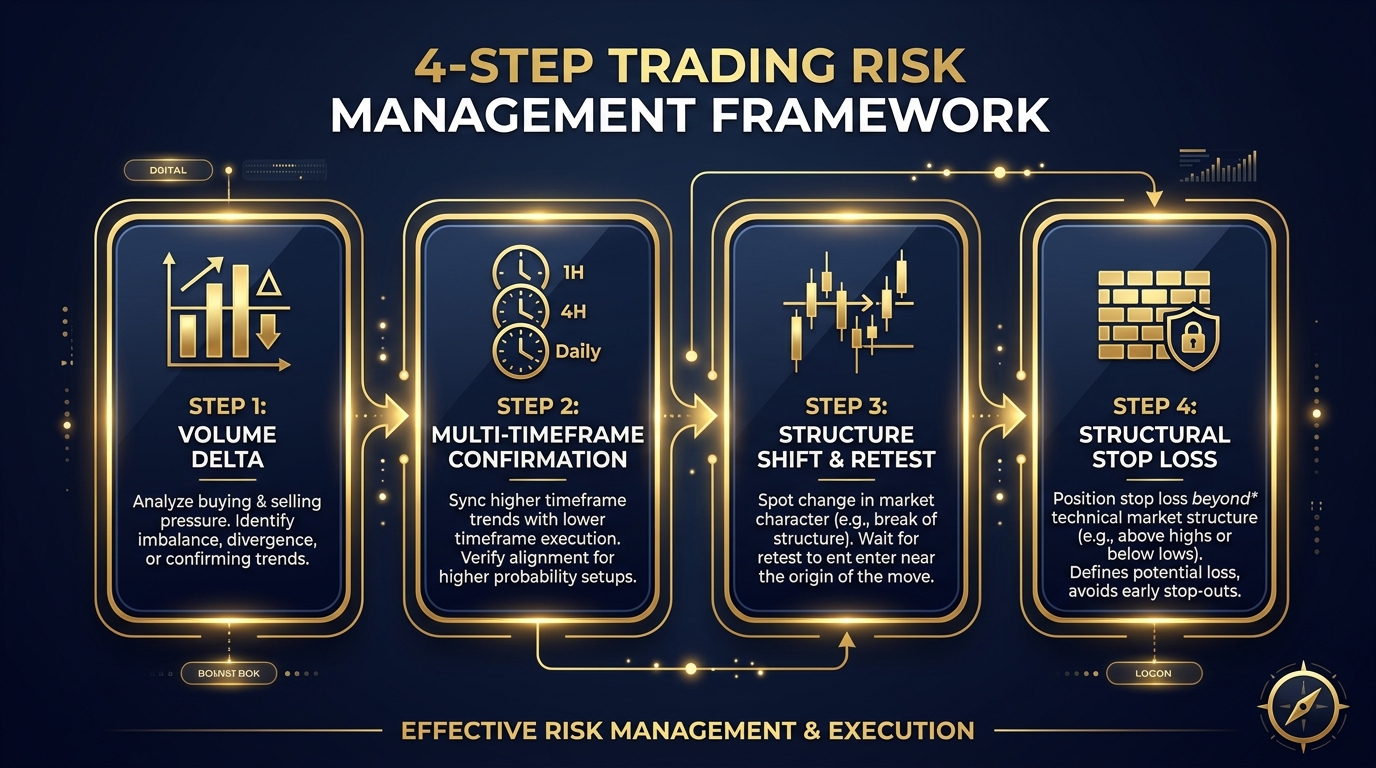
The quantitative 4-Layer Filter Architecture validates institutional setups:
Defines overarching long-term market structure, ensuring positions align with primary institutional trends while avoiding dangerous counter-trend traps.
Pinpoints supply-demand imbalances and unmitigated liquidity pools to establish high-conviction target levels.
Detects clean geometric consolidation and reversal patterns, unlocking high-precision entries with tight risk parameters.
Measures volume expansion and aggressive delta flow to confirm institutional backing before sending execution alerts.
Executing the 4-layer filter requires strict non-negotiable discipline: If a setup meets only 3 of 4 criteria, it is disqualified. Patiently waiting for full four-layer confluence consistently yields superior risk-adjusted returns compared to chasing ambiguous moves.
For instance, when the Daily (D1) trend is firmly bullish and the 4-Hour (H4) chart completes a low-volume retest of demand, a strong 1-Hour (H1) reversal candle accompanied by aggressive delta buying creates an exceptionally high-probability trade entry.
Intelligent Portfolio Management: Tracking Dashboard & Rebalancing Alerts
Long-term performance stems from mathematical asset allocation and disciplined periodic rebalancing to manage market volatility. Rigorous risk management protects profits across various economic cycles.
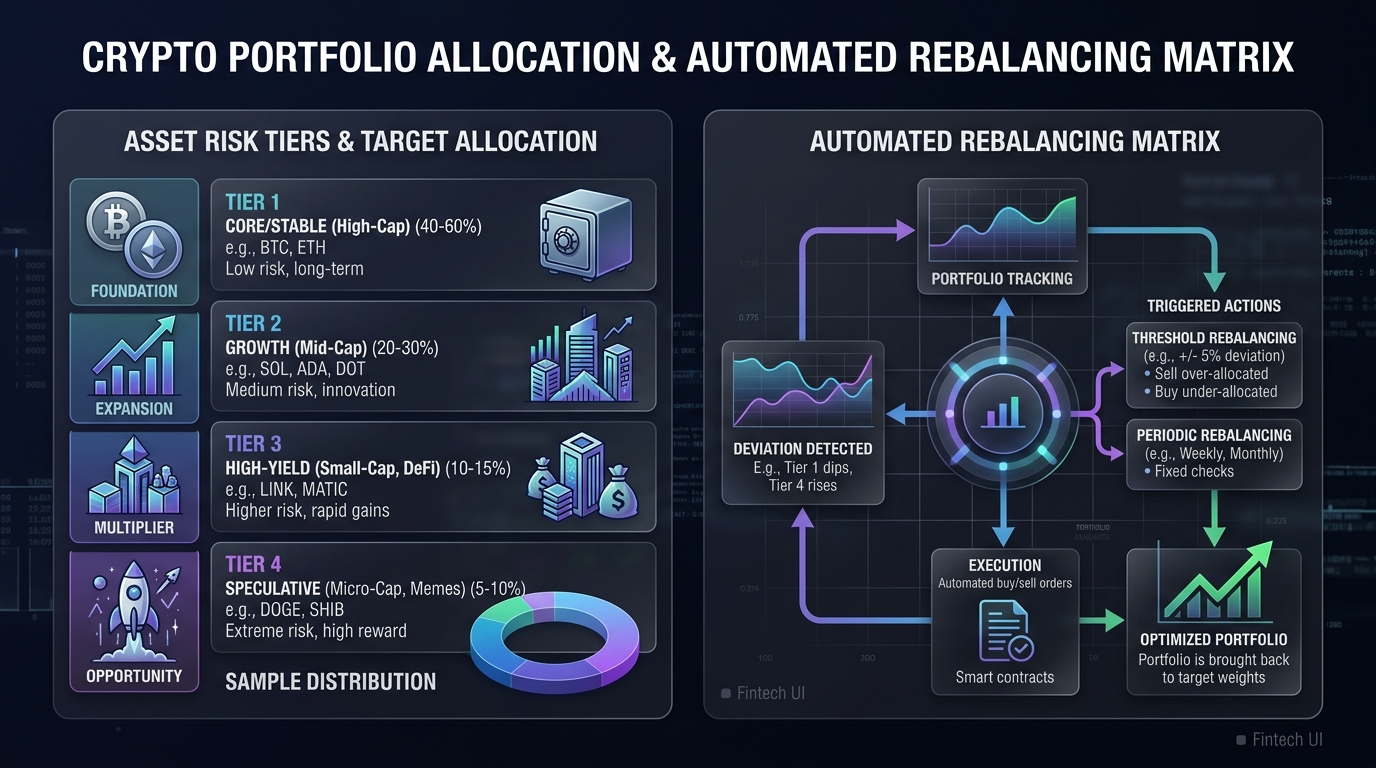
The standardized 4-Tier Portfolio Allocation Model:
| Asset Tier | Target Weight | Representative Assets | Strategic Role |
|---|---|---|---|
| Tier 1: Core Pillar (Capital Preservation) | 40% - 60% | Bitcoin (BTC), Ethereum (ETH), Cash/Stables | Preserves capital and cushions portfolio against broad market drawdowns |
| Tier 2: Growth Engines (High Conviction) | 20% - 30% | Leading Layer-1/Layer-2 chains and core infrastructure | Maximizes alpha during primary market expansion cycles |
| Tier 3: Cashflow Yield (High Upside) | 10% - 15% | DeFi protocols with proven fee generation | Generates accelerated yield and tactical returns |
| Tier 4: Early Innovation (Asymmetric Bets) | 5% - 10% | Emerging micro-caps and frontier technologies | Captures exponential upside with strictly capped risk |
Automated portfolio rebalancing turns profit-taking into an objective routine. During explosive bull rallies, high-beta speculative holdings may balloon from 10% to 25% of total value. Without rebalancing rules, investors often hold on greedily, suffering catastrophic drawdowns when tides turn.
By setting threshold alerts (e.g. any allocation drifting >5% from target), investors systematically trim winning positions into cash and core defensive assets, maintaining total strategic control regardless of economic volatility.
When an asset class outperforms and exceeds target thresholds, rebalancing locks in gains and rotates capital into safe-haven preservation assets.
The Comprehensive Ecosystem for Professional Investors
The Gemral ecosystem delivers institutional-grade solutions to elevate trading methodology and streamline routine operations:

Trading Starter Masterclass
Master 7 core reversal candlestick patterns, multi-timeframe risk frameworks, and disciplined probabilistic trading logic.

GEM Scanner PRO (1-Year Access)
Automated pattern recognition, 4-layer quantitative filtering, and instant mobile push alerts delivered 24/7.

Supreme Amethyst Crystal Set
Natural high-vibrational amethyst crystals that neutralize EMF radiation, fostering a calm, focused mindset during market analysis.
Conclusion: The Survival & Sustainable Growth Roadmap for Retail Traders
Financial markets represent an arena demanding thorough technological and methodological preparation. Enduring success belongs to investors who build a disciplined, highly repeatable operational routine across all market regimes.

Combining precise on-chain analysis with automated AI scanning saves hours of screen time, preserves emotional stability, and cements an enduring edge against sudden market volatility.
A successful investment journey is a dedicated cultivation of methodology, self-awareness, and systematic risk management. Ultimate market victors are those who safeguard their capital during storms to capitalize aggressively when asymmetric opportunities emerge.
By synthesizing sharp analytical logic, automated intelligence, and a serene mental state, you can master a professional, tranquil, and sustainably prosperous investment approach.
5 Inviolable Rules Derived From This Report
- 1. Respect On-Chain Data: Always prioritize tracking long-term accumulation footprints left by institutional Smart Money.
- 2. Audit Tokenomics Meticulously: Avoid long-term exposure to predatory low-float projects burdened with massive cliff unlocks.
- 3. Recognize Liquidity Traps: Patiently wait for confirmation wicks signaling completed liquidity sweeps before executing entries.
- 4. Leverage Systematic Automation: Utilize AI scanners to objectively survey multi-timeframe market opportunities without bias.
- 5. Enforce Strict Allocation Controls: Cap single-trade risk at 1% of total portfolio and maintain a robust defensive core reserve.
All information, on-chain data, tokenomics models, and technical analyses in this report are compiled strictly for academic and educational research. Nothing constitutes financial or investment advice. Financial markets involve inherent volatility. Readers must conduct independent due diligence (DYOR) and bear sole responsibility for their investment decisions.
Ready to Master Automated Market Surveillance with GEM Scanner PRO?
Simplify your morning market analysis routine with the assistance of an advanced AI pattern recognition scanner.