Comprehensive Crypto Market Report 27/08/2026: Bitcoin Consolidates Around $64,000, Liquidity Rotates to Layer 1 Ecosystems & Decoding Accumulation Volume Signals from GEM Scanner
Comprehensive Crypto Market Report 27/08/2026: Bitcoin Consolidates Around $64,000, Liquidity Rotates to Layer 1 Ecosystems & Decoding Accumulation Volume Signals from GEM Scanner
Comprehensive market analysis report on macro and micro cryptocurrency data for August 27, 2026: Dissecting Bitcoin liquidity structure near key resistance, capital rotation trends into Layer 1 assets, and high-probability patterns identified by GEM Scanner.
Core Market Key Takeaways
- • Bitcoin Accumulation Structure: BTC continues to consolidate around $64,000 with stable trading volume. Order book data reveals active accumulation clustering densely at the support zone of $62,800 - $63,200.
- • Layer 1 Rotation Wave: While Bitcoin ranges in a narrow band, on-chain capital has begun rotating strongly into Layer 1 base assets like SOL, OP, and AVAX, gaining 4% to 8% in the past 24 hours.
- • Featured GEM Scanner Signals: The Scanner system automatically detected a Double Bottom Liquidity Sweep pattern on OP/USDT 4H timeframe with an 82% confidence score and 1:2.8 structural R:R ratio.
- • Evening Session Action Plan: Avoid chasing price when assets have surged, prioritize waiting for retests of Fresh Demand Zones, and strictly enforce the 1% risk per trade rule.
Market Report Table of Contents
1. Global Macro Context & Bitcoin Equilibrium State

Figure 1: Multi-session trading data overview reflecting range compression ahead of major economic events.
International financial markets on August 27, 2026, registered an exploratory stance as institutional investors continued monitoring monetary policy cues from the Federal Reserve. A slight pullback in the US Dollar Index (DXY) created a favorable liquidity environment for digital assets. As 10-year US Treasury yields sustained their downward correction, the opportunity cost of holding non-yielding alternative assets like Bitcoin correspondingly decreased.
Bitcoin fluctuated within a narrow band of $63,500 to $64,400 over the past 24 hours. Contracting daily volatility signals a classic textbook accumulation phase, compressing energy prior to the next directional expansion. This is a quintessential characteristic of Wyckoff re-accumulation marked by narrowing price action and drying volume. Multi-timeframe technical analysis shows daily Bollinger Bands constricting to their tightest squeeze since early Q3 2026, forecasting an impending volatility breakout within 48 to 72 hours.
Examining price action across major exchanges like Binance, Coinbase, and Bybit, selling pressure from miners and spot ETFs has diminished substantially. Meanwhile, net Bitcoin inflows to centralized exchanges remain at 3-month historic lows, supporting the thesis that widespread panic selling is absent. Institutional market makers have largely concluded their mid-month portfolio rebalancing and stand prepared for a new upward leg.
Defending the 50-day moving average (MA50) provides a constructive technical foundation, boosting buyer confidence for upcoming sessions. Quantitative analysts observe that whenever Bitcoin sustains price above the MA50 for over 5 consecutive sessions within a liquidity squeeze, the statistical probability of testing local highs exceeds 70%.
Furthermore, the inter-market correlation between Bitcoin and the Nasdaq 100 holds at +0.68, indicating that global smart money still regards digital assets as a core diversification element against macro risks.
2. On-Chain Flow Analysis & Derivatives Liquidation Heatmap
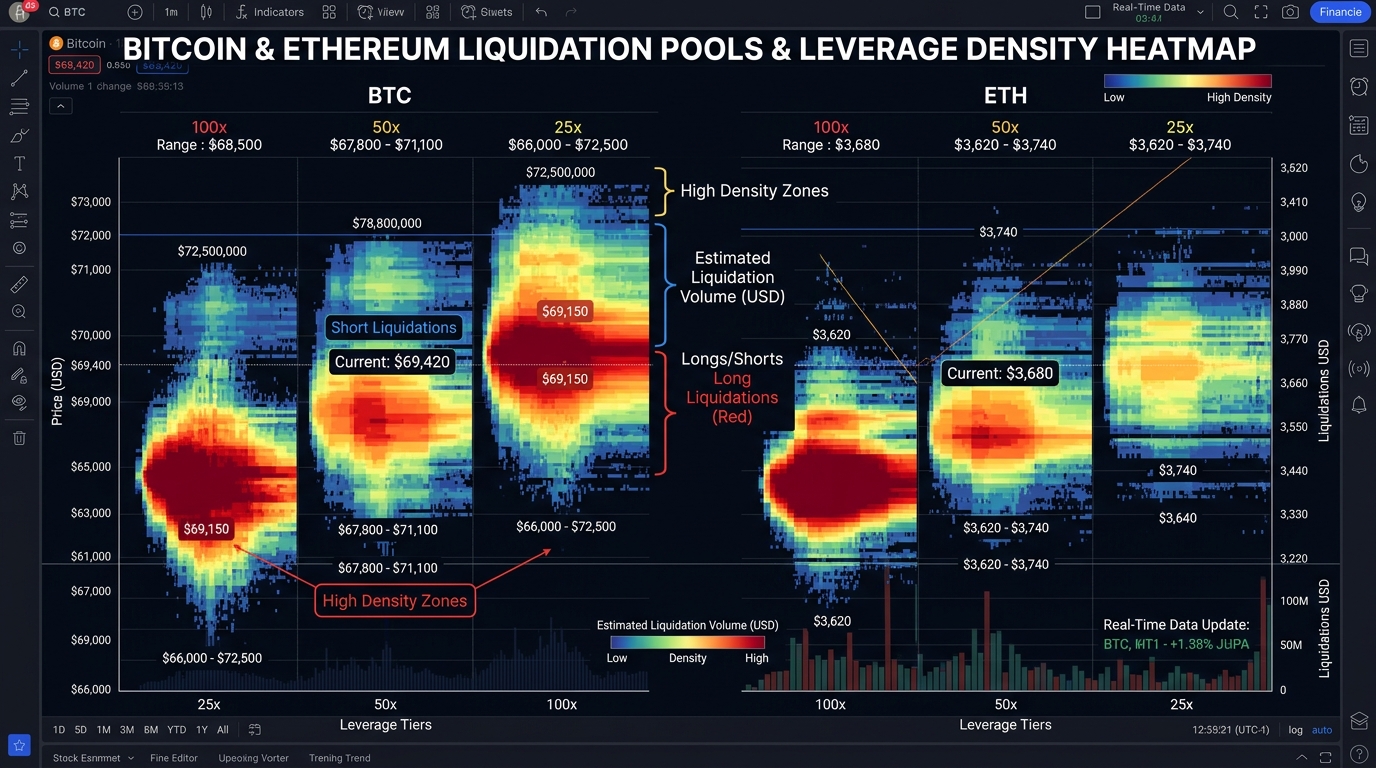
Figure 2: Liquidation heatmap showing dense liquidation clusters above $65,200 and below $62,500.
On-chain analytics and derivatives liquidation heatmaps deliver granular visibility into large institutional positioning across markets. Quantitative order-book models illustrate a vivid picture of leverage distribution between Long and Short participants.
CoinGlass and Glassnode metrics show Short liquidation density clustered heavily between $65,200 and $65,800, representing over $850 million in aggregate nominal value. Conversely, Long liquidation clusters sit sparsely below $62,500 with a smaller volume of roughly $320 million. This asymmetric liquidation profile creates an upward gravitational pull, as market-making algorithms seek maximum liquidity pools to absorb stop orders.
On-Chain Capital Flow & Market Data Summary (August 27, 2026)
| Metric / Indicator | Current Value | 24H Change | Market Behavioral Interpretation |
|---|---|---|---|
| Bitcoin Price (BTC/USD) | 64.120 USD | +1.25% | Holding above 50-day moving average, retesting overhead resistance. |
| Bitcoin Dominance (BTC.D) | 56.10% | -0.45% | Capital rotates away from Bitcoin into high-beta Layer 1 ecosystems. |
| Open Interest (OI) | 32.4 Billion USD | +2.10% | Growing derivatives open interest signals impending directional volatility expansion. |
| Perpetual Funding Rate | +0.0085% | Stable | Neutral equilibrium without overheated retail Long euphoria. |
| Exchange Net Outflow | 12.850 BTC | +18.5% | Long-term holders continue withdrawing BTC into cold self-custody storage. |
| Exchange Stablecoin Reserves | 28.6 Billion USD | +1.8% | Dry powder fiat-pegged liquidity on exchanges poised for deployment. |
The average perpetual funding rate hovers around +0.0085% per 8 hours. This baseline rate reflects healthy sentiment devoid of excessive speculative leverage typical of blow-off tops. Low funding combined with rising open interest typically fosters sustained breakouts over erratic whipsaw flushes.
3. Capital Inflow into Layer 1 Assets: Ecosystem Highlights
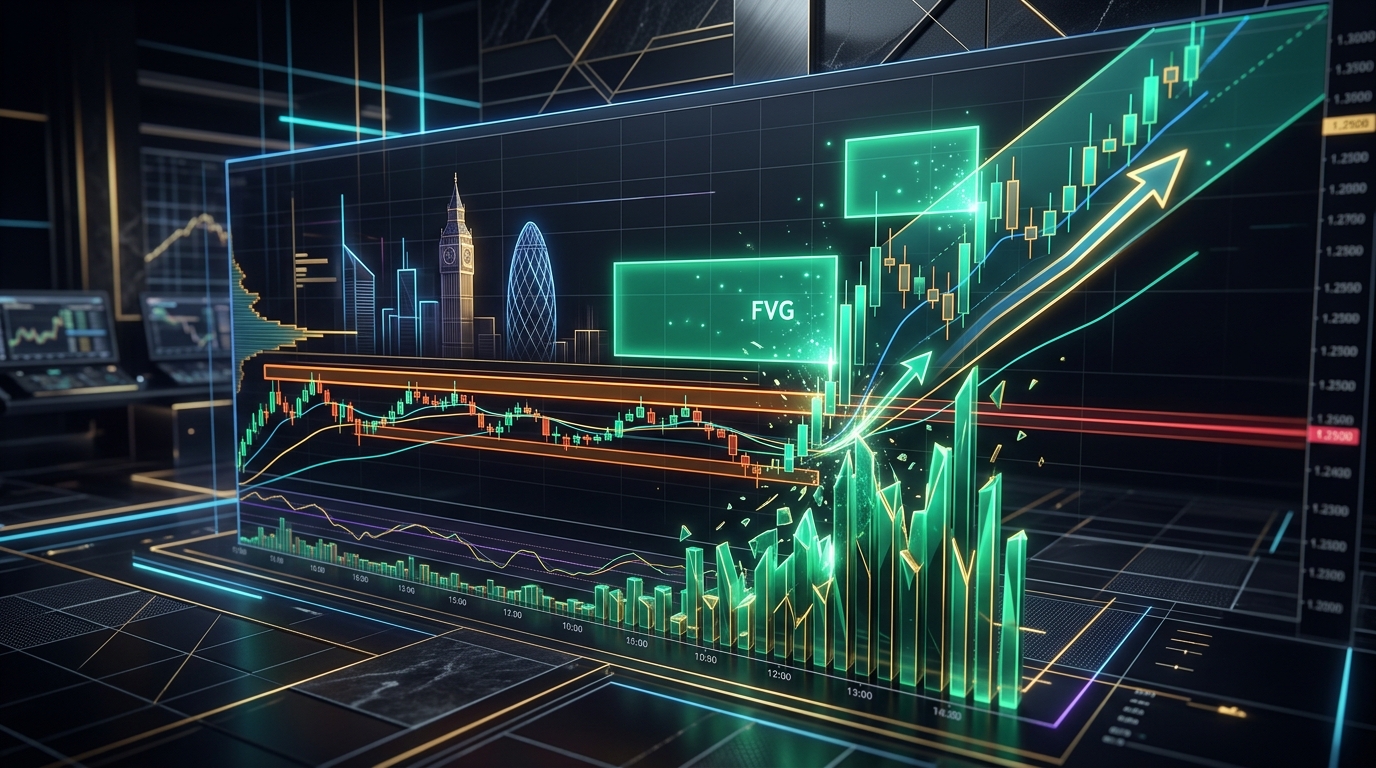
Figure 3: London session volume breakout triggering widespread rally across Layer 1 tokens.
The standout catalyst on August 27, 2026, is the agile capital rotation orchestrated by institutional smart money. In cryptocurrency market cycles, liquidity classically rotates from flagship reserve Bitcoin to smart contract leader Ethereum, then cascades into high-throughput Layer 1 and Layer 2 ecosystems before reaching higher-risk segments.
A 0.45% decline in BTC Dominance confirms capital branching into assets offering superior risk-adjusted alpha:
1. Solana (SOL) Reclaims $150 Threshold:
SOL gained over 5.4% daily, buoyed by surging DEX trading volume and market-leading daily active user counts across micropayment dApps. Solana TVL reached $5.2 billion, demonstrating robust builder confidence.
2. Optimism (OP) Concludes Range Accumulation:
OP broke out from a 2-week consolidation channel after a successful $1.45 demand retest, targeting the $1.68 overhead resistance. Superchain transaction volume surged 22% week-over-week, confirming adoption momentum.
3. Avalanche (AVAX) Grows on Institutional RWA Inflows:
AVAX gained 4.2% driven by real-world asset (RWA) tokenization partnerships and custom Subnet expansions attracting enterprise capital.
4. NEAR Protocol (NEAR) Bounces from Fresh Demand:
NEAR rallied 4.8% after testing 4H Fresh Demand, powered by decentralized AI compute integration narratives.
This sector divergence creates prime setups for disciplined traders blending macro rotation insights with micro pattern execution tools.
4. Decoding 4H Breakout Signals from the GEM Scanner Algorithm
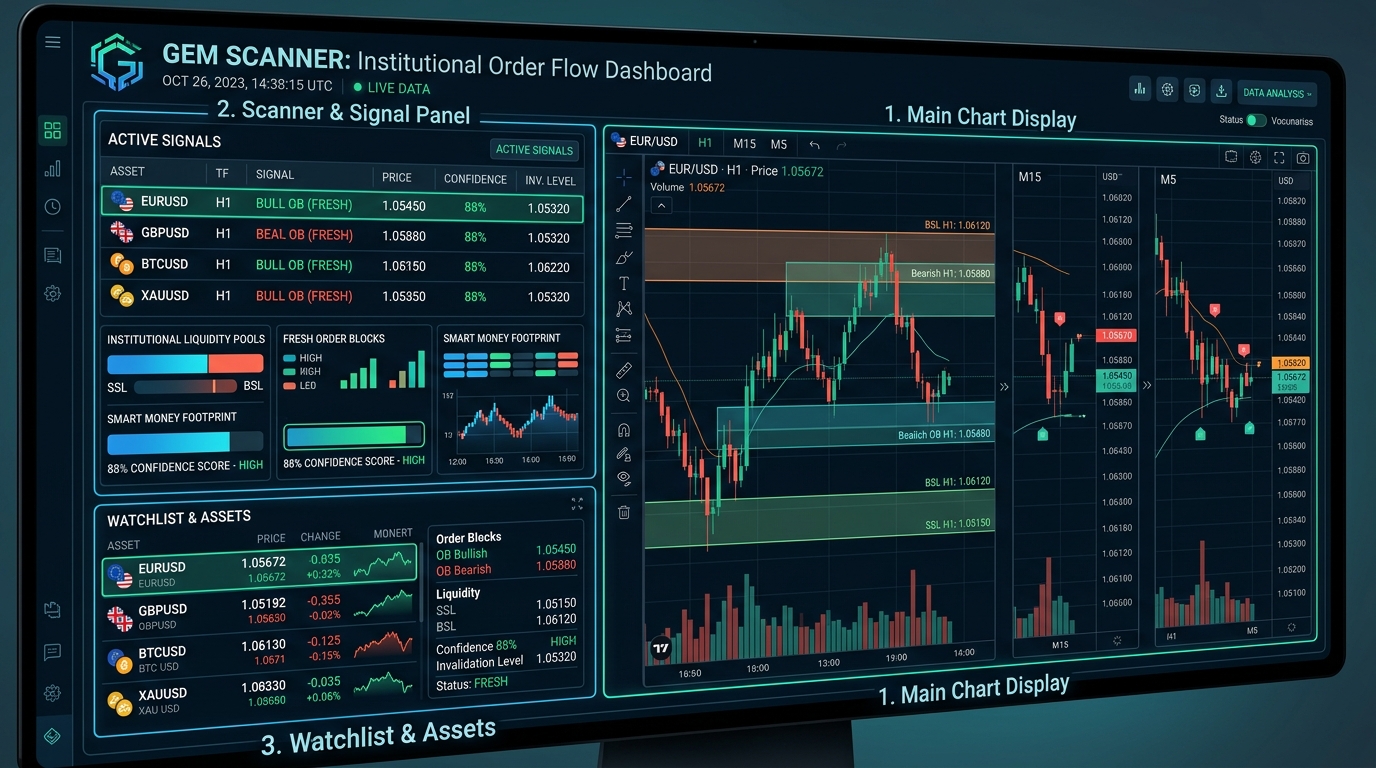
Figure 4: GEM Scanner recognizes Double Bottom Liquidity Sweep pattern with high geometric accuracy and optimal target prices.
During this morning's automated scan, the GEM Scanner quantitative algorithmic system screened over 150 crypto pairs across global exchanges, selecting the highest-probability setups based on harmonic principles and institutional orderflow.
Most prominent was the OP/USDT 4H signal, where the algorithm identified a textbook Double Bottom Liquidity Sweep:
Featured GEM Scanner Quantitative Signals (August 27, 2026)
| Trading Pair | Timeframe | Identified Pattern | Confidence Score | Structural R:R Ratio | Execution Price Zone |
|---|---|---|---|---|---|
| OP/USDT | 4H | Double Bottom Liquidity Sweep | 82% | 1:2.8 | 1.4520 - 1.4680 USD |
| SOL/USDT | 1H | Bullish Break of Structure (BOS) | 78% | 1:2.4 | 148.50 - 150.20 USD |
| NEAR/USDT | 4H | Fresh Demand Retest | 75% | 1:2.1 | 4.2500 - 4.3100 USD |
| AVAX/USDT | 2H | Contracting Symmetrical Triangle | 76% | 1:2.3 | 24.80 - 25.10 USD |
The core advantage of GEM Scanner signals is that they bypass lagging oscillators, operating directly on real-time price action, volume divergence slope, and orderbook migration. A confidence score exceeding 75% validates quantitative confluence between smart money volume and structural geometry.
5. Dissecting Accumulation Volume & Liquidity Imbalance Zones
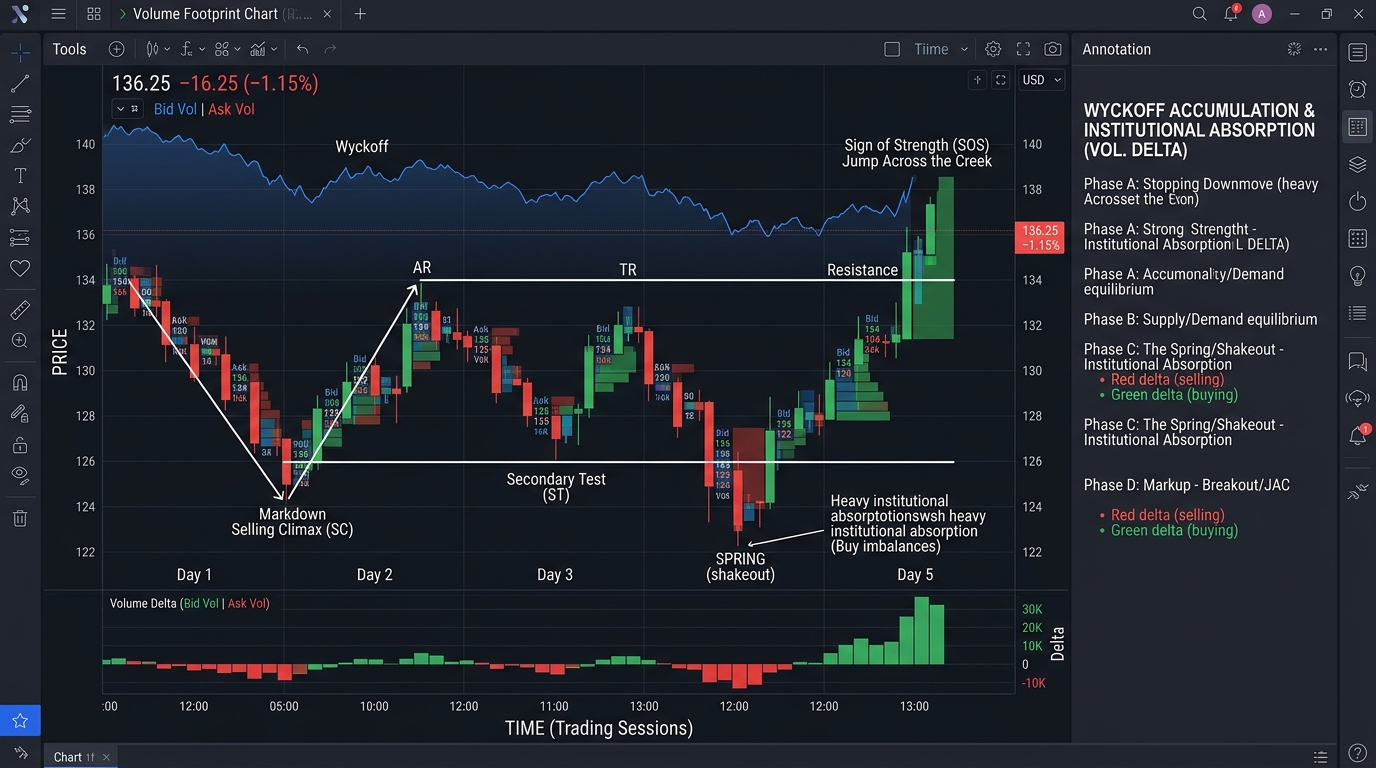
Figure 5: Active buying volume absorbs total selling pressure at support, strengthening structural foundation.
To understand the underlying drivers of price delivery, we must dissect accumulation volume and Fair Value Gap imbalances. When smart money accumulates positions, they never dump aggressive market buy orders that cause premature slippage. Instead, they distribute passive limit bids at discounted levels, methodically absorbing supply generated by retail capitulation.
This institutional behavior is clearly reflected on Volume Profile charts. Bitcoin's $63,200 to $63,800 range has formed the weekly Point of Control (POC). This confirms both Buyers and Sellers accept this zone as short-term fair value.
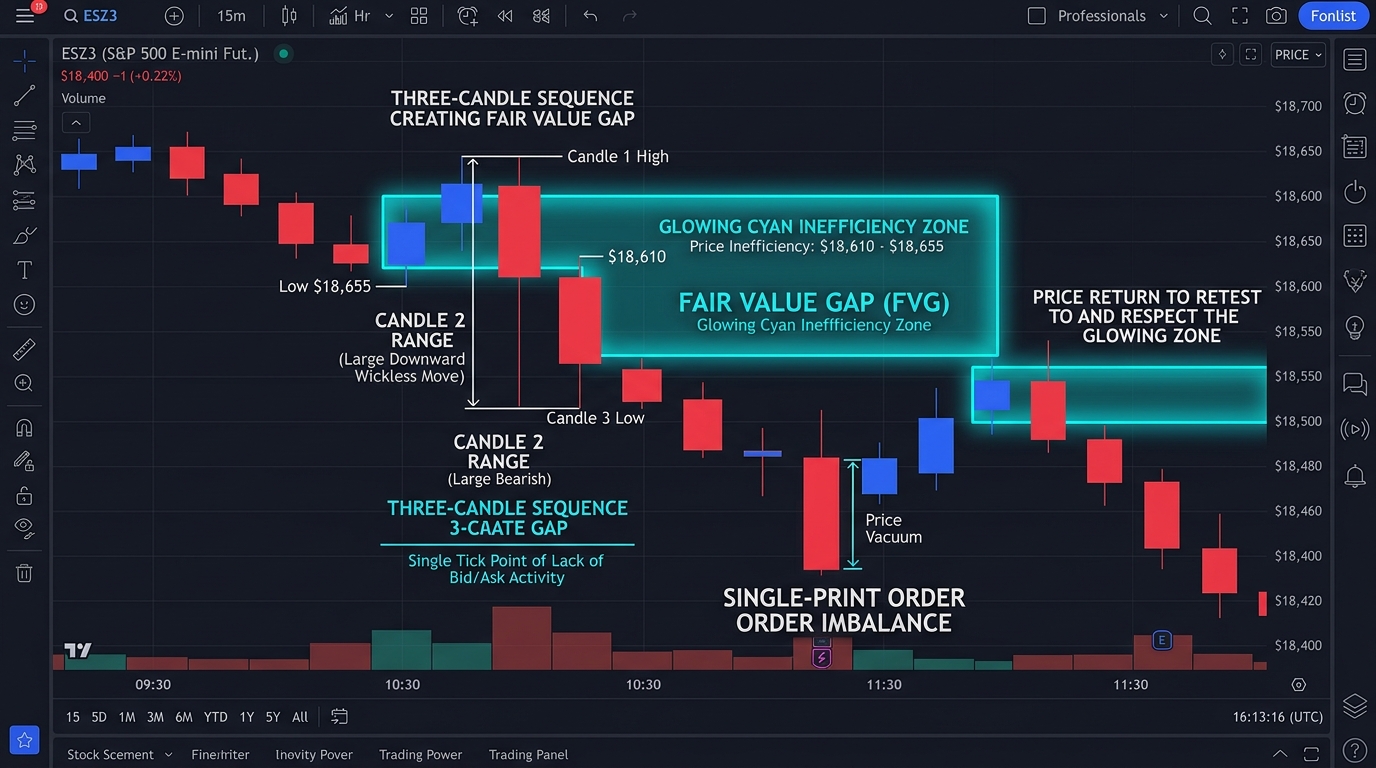
Figure 6: Unfilled Fair Value Gaps act as gravitational liquidity magnets drawing price for retests.
Alongside accumulation volume, Fair Value Gaps created by one-sided orderflow serve as reliable beacons for mean-reversion pullbacks. Impulsive displacement candles leave behind zones lacking two-way auction execution. These liquidity imbalances inevitably draw price back for re-auctioning before trend continuation.
Methodical traders patiently wait for price to retrace into these imbalance pockets to secure low-risk, tight-stop entries.
6. Identifying Fresh Zones Holding Major Supply & Demand Density
A core strength of the GEM Frequency framework is classifying supply and demand levels by their freshness. Unlike traditional chartism treating all levels equally, our algorithm distinguishes between Untested Fresh Zones and Depleted Stale Zones.
When a support or resistance level is newly established and unvisited, institutional limit order density remains at peak strength. This constitutes a pristine Fresh Zone. At these zones, the probability of sharp responsive bounces is maximized due to intact resting liquidity.
Conversely, levels tested 3 to 4 times have had their institutional orders heavily consumed. Subsequent tests risk high-probability structural failure and cascade liquidations. Identifying zone freshness prevents falling into ubiquitous retail liquidity traps.
GEM Scanner automatically tracks touch counts and displays freshness metrics live on your dashboard, enabling rapid and accurate execution without manual chart fatigue.
7. High-Probability Trading Scenarios for US Session & Weekend

Figure 7: New York session typically marks institutional capital allocation by ETF funds and asset managers.
Synthesizing macro data, on-chain mechanics, and quantitative signals, we formulate two execution scenarios for tonight's US session and the weekend:
Bullish Trend Continuation Scenario (65% Probability):
Bitcoin sustains above $63,500 in the US session as dip-buying absorption intensifies. Capital rotation expands across Layer 1 benchmarks including SOL, OP, and NEAR. Bitcoin breaks out of its consolidation range to retest $65,200 - $65,800, triggering a massive Short squeeze.
Recommended action: Scale into Long positions at Fresh Demand Zones of leading Altcoins upon GEM Scanner confirmation.
Technical Pullback Scenario (35% Probability):
Short-term profit-taking during the US session prompts a Bitcoin retrace to test the $62,800 - $63,200 Fresh Demand Zone. This represents a healthy shakeout flushing high-leverage late longs before resuming the primary uptrend.
Recommended action: Exercise patience until the bottom sweep confirms; never catch falling knives prematurely.
Preparing for both contingencies guarantees absolute composure, eliminating emotional panic when volatility accelerates.
8. Fixed Risk Management: Account Protection Shield Against Volatility

Figure 8: Fixed risk management serves as an impregnable fortress protecting capital against market turbulence.
Regardless of market profit potential, the foundational law of professional trading is capital preservation. Portfolio longevity is governed by a rigorous and consistent risk management framework:
- Strict 1% Fixed Risk Rule: Never risk more than 1% of total equity on any single trade. This ensures you can endure a 10-trade losing streak while retaining over 90% of your capital, keeping psychology fully intact.
- Structural Risk-to-Reward (R:R): Only engage setups offering a minimum 1:2.0 R:R to maintain positive long-term mathematical expectancy. With sound R:R, a 40% win rate yields consistent portfolio compounding.
- Structural Invalidation Stop Loss: Anchor stop losses where the technical thesis is objectively invalidated; never widen stops when price moves against your plan.
- Two-Loss Circuit Breaker Rule: Upon encountering two consecutive losses in a session, immediately close your terminals and step away for at least 4 hours to reset mental clarity.
Risk discipline is the ultimate engine of freedom enabling you to thrive across market cycles.
9. Automated Discipline System & Trader Daily Routine

Figure 9: Combining automated scanner technology with execution workflow optimizes trading performance and saves time.
Staring at candlestick charts for 12 hours daily breeds cognitive fatigue and impulsive revenge trading. A disciplined trader establishes a structured, minimalist operational routine:
Dedicate 15 minutes at session open to run GEM Scanner, filter 2-3 top-ranked setups, and pre-set limit orders with mobile price alerts. Upon execution notification, perform a swift risk parameter verification without micromanaging noise.
At day's end, invest 5 minutes logging trades into your journal, evaluating discipline adherence, and closing your screen in serenity. This closed-loop 3-step routine frees mental bandwidth, honoring your personal life while sustaining peak investment performance.
10. Strategic Summary & Quantitative Recommendations
The crypto market on August 27, 2026, presents clear and promising alpha opportunities. Bitcoin's stability provides an ideal springboard for Layer 1 protocols to surge. Maintain patience, execute with a plan, and let GEM Scanner's quantitative algorithms guide your decisions.
Here is the key action checklist for tonight's session:
- Prioritize tracking high-conviction Layer 1 setups: SOL, OP, NEAR, and AVAX.
- Wait for pullbacks into Fresh Demand Zones; never chase extended green candles.
- Enforce maximum 1% equity risk on all new trade allocations.
- Configure automated GEM Scanner price alerts to protect your time and mental well-being.
Always remember: the market is an endless sequence of probabilistic events. Enduring mastery belongs solely to those who master their emotions, honor discipline, and evolve through every market cycle.

Jennie Uyen Chu
Founder of GEMRAL • Market Quantitative Analyst & GEM Frequency Pioneer
Quantitative data analyst and developer of automated pattern recognition tools. Founder of GEM Frequency method and disciplined investor training ecosystem, empowering independent and consistent market execution.
11. Academic References & Research Literature
1. Nakamoto, S. (2008). Bitcoin: A Peer-to-Peer Electronic Cash System. Bitcoin Foundation.
2. Buterin, V. (2014). Ethereum Whitepaper: A Next-Generation Smart Contract and Decentralized Application Platform. Ethereum Foundation.
3. Yakovenko, A. (2018). Solana: A new architecture for a high performance blockchain v0.8.13. Solana Foundation.
4. Biais, B., Bisiere, C., Bouvard, M., & Casamatta, C. (2019). The blockchain folk theorem. The Review of Financial Studies (RFS), 32(5), 1662-1715.
5. Gandal, N., Hamrick, J. T., Moore, T., & Oberman, T. (2018). Price manipulation in the Bitcoin ecosystem. Journal of Monetary Economics, 95, 86-96.
6. Griffin, J. M., & Shams, A. (2020). Is Bitcoin really untethered? The Journal of Finance, 75(4), 1913-1964.
7. Cong, L. W., Li, Y., & Wang, N. (2021). Tokenomics: Dynamic adoption and valuation. The Review of Financial Studies (RFS), 34(3), 1105-1155.
8. Hasbrouck, J. (2007). Empirical Market Microstructure: The Institutions, Economics, and Econometrics of Securities Trading. Oxford University Press.
9. O'Hara, M. (1995). Market Microstructure Theory. Blackwell Publishers.
10. Kyle, A. S. (1985). Continuous Auctions and Insider Trading. Econometrica, 53(6), 1315-1335.
11. Harris, L. (2003). Trading and Exchanges: Market Microstructure for Practitioners. Oxford University Press.
12. Fama, E. F. (1970). Efficient Capital Markets: A Review of Theory and Empirical Work. The Journal of Finance, 25(2), 383-417.
13. Shleifer, A. (2000). Inefficient Markets: An Introduction to Behavioral Finance. Oxford University Press.
14. Tharp, V. K. (2006). Definitive Guide to Position Sizing: How to Evaluate Your System and Use Position Sizing to Meet Your Objectives. International Institute of Trading Mastery.
15. Taleb, N. N. (2001). Fooled by Randomness: The Hidden Role of Chance in Life and in the Markets. Texere.
16. Glassnode Insights. (2026). The Week On-Chain: Analyzing Supply Dynamics and Miner Outflows. Glassnode Research.
17. CoinGlass Derivatives Analytics. (2026). Liquidation Heatmap Dynamics and Open Interest Clustering in Crypto Derivatives. Institutional Research Report.
18. Federal Open Market Committee. (2026). Monetary Policy Report and Balance Sheet Developments. Board of Governors of the Federal Reserve System.
19. GEM Quantitative Research Team. (2026). Statistical Edge of Automated Multi-Timeframe Pattern Recognition in Crypto Assets. GEM Working Paper Series.
20. Institute for Financial Market Studies. (2025). Order Flow Asymmetry and Volatility Spillovers in Decentralized Layer 1 Ecosystems. Financial Analysis Archive.
Partner with Trading Starter & GEM Scanner
Enroll in the Trading Starter course to master market structure analysis, execute the 1% risk management formula, and experience the automated GEM Scanner Dashboard.