Dissecting Spot ETF Flows & Q3/2026 Token Unlock Pressure: Institutional Leverage Confronts a $1.4B Supply Avalanche
Dissecting Spot ETF Flows & Q3/2026 Token Unlock Pressure:
Institutional Leverage Confronts a $1.4B Supply Avalanche
A comprehensive survey of the digital asset landscape during the late August 2026 phase shift: Analyzing the historic clash between passive Wall Street ETF inflows and the massive supply dilution wave from AI and Layer-2 projects.

The Battle for Control Over Global Liquidity
When institutional buying power collides with peak venture capital unlock schedules.
RESEARCH REPORT CONTENTS
01 MARKET OVERVIEW & AUGUST 2026 LIQUIDITY LANDSCAPE: INSTITUTIONAL INFLOWS MEET THE 80K CORRECTION
August 2026 enters the history of digital asset markets as one of the most profound capital divergence periods ever recorded on-chain. The month began with subdued range-bound accumulation typical of the Western summer lull, as Bitcoin's volatility compressed tightly within the $63,000 – $64,000 range. This apparent calm was merely a facade concealing a massive positioning realignment across institutional desks and algorithmic derivatives liquidity sweeps.
Between August 19 and 22, the market ignited with a violent short liquidation squeeze, wiping out over $1.6 billion in short positions across major exchanges and propelling Bitcoin above $80,000 to a local high of $81,450. However, instead of triggering a sustainable parabolic rally, the market swiftly encountered an immense profit-taking wall compounded by hawkish monetary signals at the Federal Reserve's Jackson Hole Symposium. By late August, price retreated to test the $77,000 – $78,500 support zone, establishing a high-stakes consolidation battlefield.

Three Pillars Dominating Market Structure in August 2026
- Liquidity Channel Shift: Capital is no longer dispersing broadly across classic altcoin season rotations, but is instead concentrating nearly 78% of flows into structured institutional vehicles (Spot ETFs, asset trusts) and real-revenue-generating protocols.
- Extreme Macro Sensitivity: Fluctuations in the US Dollar Index (DXY) and the 10-year Treasury yield (US10Y) translate within 15 minutes into Bitcoin order book volatility via Chicago-based algorithmic arbitrage desks.
- Acute Bifurcation Between Bitcoin and Utility Tokens: While Bitcoin strengthens its status as a strategic sovereign asset, hundreds of utility tokens face drying order book depth and relentless liquidation pressure from team and VC unlock schedules.
02 DISSECTING SPOT BITCOIN ETF FLOWS: SMART MONEY FOOTPRINTS & DXY/FED RATE CORRELATION
On-chain data over the past 30 days reveals that capital flows into US Spot Bitcoin ETFs serve as the primary liquidity pressure valve for the broader market. Over a 7-day span between August 15 and 25, ETFs managed by BlackRock, Fidelity, and Bitwise recorded cumulative net purchases exceeding $2.57 billion. This was the fundamental catalyst behind the push above $80,000.
However, institutional ETF capital in 2026 operates with a heavy bias toward defensive basis trading rather than purely passive long-term accumulation. Hedge funds concurrently purchase Spot ETF shares while shorting CME Bitcoin futures, locking in an 8% to 12% annualized risk-free basis yield. When short-term US Treasury yields remain elevated, the relative attractiveness of this spread narrows, causing rapid net outflows during the final week of August.
Table 2.1: Spot ETF Inflows & Macro Metric Breakdown (August 2026)
| Period | Net ETF Inflow | DXY Movement | US10Y Yield | BTC Price Action | Capital Flow Regime |
|---|---|---|---|---|---|
| 01/08 - 10/08 | -$340M | 104.2 -> 103.8 | 3.88% | 63.2K -> 64.5K | Low-liquidity accumulation |
| 11/08 - 25/08 | +$2,570M | 102.5 -> 101.8 | 3.79% | 64.5K -> 81.4K | Aggressive institutional buying |
| 26/08 - 30/08 | -$480M | 101.8 -> 103.1 | 3.94% | 81.4K -> 77.8K | Profit taking & De-risking post-Jackson Hole |
The Federal Reserve's 'higher-for-longer' guidance at Jackson Hole sparked an immediate rebound in the DXY from 101.8 to 103.1. This tightening of global US dollar liquidity erected a formidable ceiling, preventing over-leveraged long positions from sustaining price expansion beyond major psychological resistance levels.
03 REALIZED CAPITALIZATION STRUCTURE & LONG-TERM HOLDER BEHAVIOR: STRATEGIC ACCUMULATION OR STEALTH DISTRIBUTION?
Bitcoin's Realized Capitalization — which values each coin at the price it last moved on-chain — expanded by over $4.6 billion in late August. This clear indicator confirms that fresh capital is entering the network, raising the aggregate baseline cost of the asset class.

However, cohort analysis of Long-Term Holders (wallets holding coins for over 155 days) reveals a nuanced transition. In early August, this cohort distributed approximately 356,000 BTC to meet ETF demand. Yet as prices retraced toward $77,000, distribution velocity plummeted by 84%, shifting into disciplined, patient accumulation.
Bullish Signal (Growth Catalyst)
The Short-Term Holder Realized Price currently sits at $71,200. This on-chain metric acts as a rock-solid psychological floor where historical corrective waves have consistently found equilibrium before resuming upward momentum.
Cautionary Signal (Downside Risk)
The 30-day growth rate of Realized Cap stands at a modest 0.4%, indicating that new liquidity is highly selective and has not yet reached the velocity required to spark a broad-based altcoin expansion wave.
04 Q3/2026 $1.4B SUPPLY AVALANCHE: DECODING AI AND LAYER-2 TOKEN UNLOCK SCHEDULES
While Bitcoin benefits from institutional backing, the broader utility token sector is bracing for a severe structural supply shock. According to smart contract vesting telemetry, Q3 2026 triggers a dense cluster of cliff unlocks totaling over $1.4 billion in liquid value, heavily concentrated in Decentralized AI and Layer-2 rollups.

AI tokens that launched during the 2024–2025 hype cycle at Fully Diluted Valuations (FDV) of $5B to $20B are now entering their 12th to 24th month of vesting. This milestone releases 15% to 25% of locked supply to early seed investors, foundation treasuries, and core teams. With aggregate daily spot exchange volume down 45% from cycle peaks, this new supply creates an immense overhang on market depth.
Sector Breakdown of Extreme Dilution Risk:
Current circulating supply is only 11% - 14%. Unlocking large tranches for hardware providers and seed investors creates sustained daily sell pressure on exchange order books.
Massive venture funding valuations face token maturity dates. Real network fee revenues offset less than 2% of the annualized inflation issuance.
L2 infrastructure saturation and fragmented user liquidity across 40+ chains have driven governance tokens into steep sell-offs upon wallet unlock.
05 RED TEAMING TOKENOMICS: THE FATAL FLAW OF HIGH FDV & ULTRA-LOW FLOAT MODELS
A foundational pillar of Gemral's research philosophy is Red Teaming — systematically challenging consensus assumptions and uncovering structural points of failure. The single most destructive mechanism of the 2026 cycle is the prevailing token design: Extremely High Fully Diluted Valuation paired with an ultra-low initial circulating supply.

When a project launches with only 5% to 10% circulating supply, market makers require minimal capital to push token prices to astronomical levels, creating paper market caps in the tens of billions. This illusion crumbles as the remaining 90% unlocks linearly. Retail market participants effectively become exit liquidity for private round investors who acquired their stakes at 10x to 50x lower entry prices.
Three Critical Tokenomics Design Flaws Inflicting Severe Losses:
Protocols promise 20% – 50% APY paid in their own inflationary token. While token holdings expand by 20%, secondary market spot prices collapse by 70% under continuous issuance sell pressure.
Protocol fee revenue is captured by private operating entities rather than distributed to token holders, reducing governance tokens to speculative assets devoid of direct economic claims.
Private OTC agreements between venture funds and trading desks enable early hedging via synthetic derivatives weeks before official on-chain unlocks, depressing spot prices ahead of schedule.
06 DERIVATIVES LIQUIDITY PARADOX: FUNDING RATES, OPEN INTEREST & THE SQUEEZE TRAP AT 78K - 80K
Derivatives markets in August 2026 recorded an explosive surge in Open Interest, reaching a record $38.5 billion across all venues. Estimated retail leverage ratios climbed to an alarming 0.28, indicating that short-term price movements are dictated by liquidation hunting rather than organic spot demand.
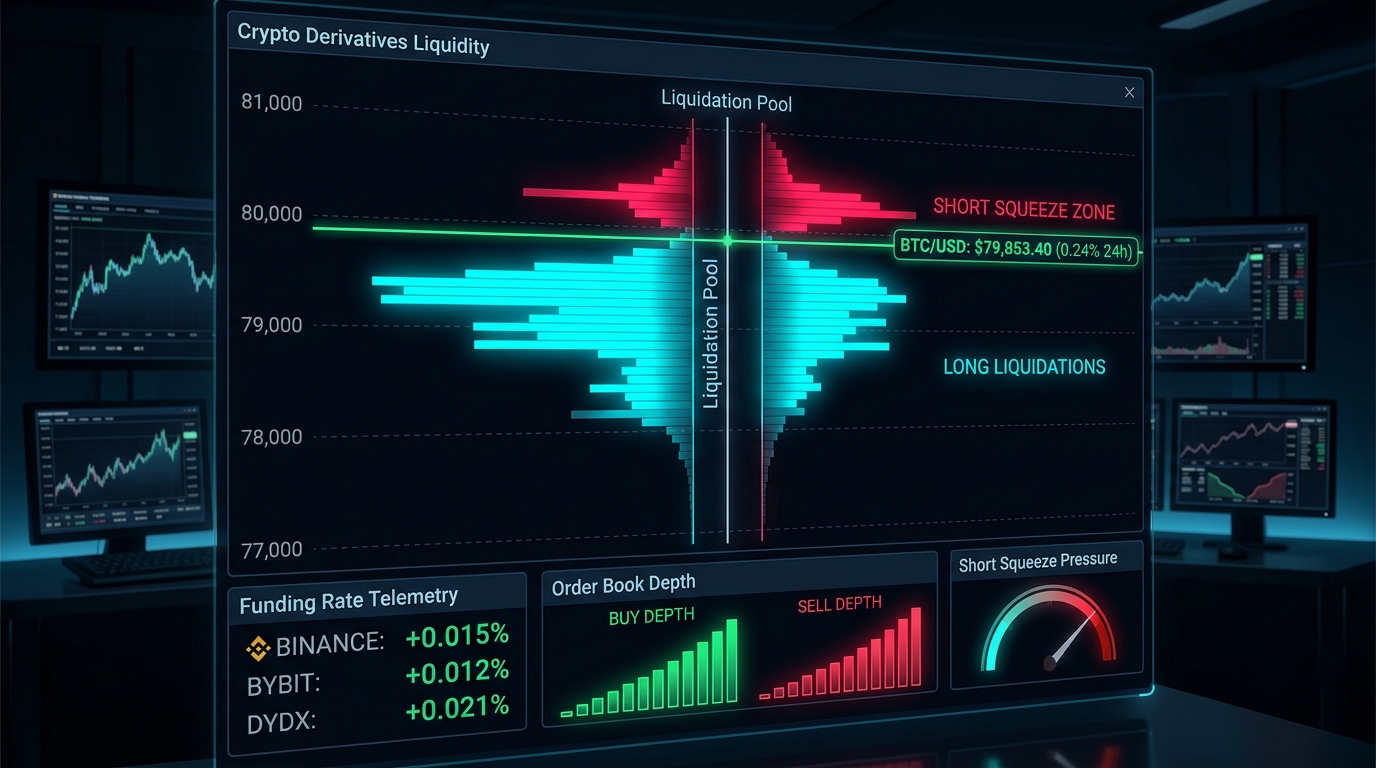
Liquidity heatmaps displayed massive short stop-loss clusters between $80,500 and $81,800, while long liquidations rested below $76,200 – $77,000. The August 22 surge to $81,450 systematically harvested overhead short liquidity. Once top-side liquidity was depleted, funding rates spiked to extreme positive territory, setting up leveraged longs as the next target for a sharp mean-reversion cascade.
Core Lesson in Reading Liquidity Footprints:
Financial markets behave like predatory organisms: price continuously hunts areas of peak stop-loss density to absorb liquidity before reversing. Trading on emotion or placing stops at generic textbook support/resistance levels serves capital directly to automated market sweeping algorithms.
07 DEFI & INFRASTRUCTURE CAPITAL ROTATION: THE RISE OF REAL YIELD & NEXT-GEN LAYER-1S
Amid supply overhangs in traditional utility tokens, a powerful structural rotation is emerging within decentralized finance. Total Value Locked (TVL) has stabilized and rebounded around $115 billion, characterized by a complete overhaul in capital allocation.

Smart money is rotating out of inflationary yield farms into Real Yield protocols — platforms where liquidity providers earn trading fees paid in hard assets such as USDC, USDT, or ETH. Next-generation decentralized perpetual exchanges and over-collateralized lending markets are generating tens of millions of dollars in monthly cash flow, demonstrating true web3 business model viability.
08 LESSONS FROM HISTORIC CRYPTO LIQUIDITY PURGES
While history never repeats itself exactly, the behavioral psychology of market crowds remains constant across every cycle. Examining past liquidity purges — Mt. Gox (2014), the 2018 burst, Terra-Luna and FTX (2022), and the violent deleveraging events of 2024–2026 — reveals an enduring pattern: Euphoric peak leverage inevitably ends in a devastating liquidity stampede.

Quality Assets Are Sold First in a Liquidity Crunch
When major funds face urgent margin calls, they do not sell what they wish to sell — they sell whatever has immediate buyer liquidity. This explains why Bitcoin frequently leads market downturns before rebounding faster than the broader ecosystem.
Survival Is the Ultimate Alpha
In trading and financial investing, enduring market victors are those who preserve capital through 30% – 50% drawdowns, positioning themselves to seize generational opportunities at cycle bottoms.
Never Base Capital Allocation on Marketing Narratives
Every narrative claiming paradigm-shifting technology or infinite price appreciation is an engineered distribution tool used by large stakeholders to offload supply onto undisciplined market participants.
09 4-SCENARIO MARKET MATRIX FOR Q3 - Q4/2026
Based on quantitative on-chain flow analysis, macroeconomic trends, and vesting schedules, the Gemral Market Research Council outlines a 4-scenario probabilistic matrix for late 2026:

Re-accumulation at 75K–78K & Breakout to New Highs
The Federal Reserve signals clear monetary easing at the September meeting. Spot ETF net inflows remain above $300M/week, fully absorbing token unlock pressure. Bitcoin breaches $85,000, inaugurating a new expansion leg for market leaders.
Extended Range-Bound Consolidation ($72K - $80K)
Global liquidity remains neutral. Bitcoin ranges sideways in a wide channel, repeatedly sweeping stops at both extremes. Altcoins undergo aggressive attrition, with capital concentrating solely on real-revenue projects.
Deep Correction to Realized Cost Basis ($68K - $71K)
$1.4B token unlocks trigger cascading sell-offs that spill over into Bitcoin, amplified by DXY strength. The market requires a complete purge of speculative leverage before establishing a durable macro bottom.
Geopolitical Flare-Up & Cross-Market Liquidity Contagion
Macroeconomic instability triggers sharp global equity corrections and aggressive capital withdrawal from risk assets. Bitcoin falls below $65,000, entering an extended period of liquidity deflation.
10 MULTI-CYCLE RISK MANAGEMENT & CAPITAL PRESERVATION FRAMEWORK
In an era dominated by high-frequency trading algorithms and billion-dollar institutional funds, relying on intuition or emotional conviction is financial suicide. Sustainable survival and compounding wealth require an ironclad discipline rooted in mathematical probability.

4 Golden Capital Preservation Principles for Professional Traders:
1% - 2% Maximum Risk Per Trade
Never risk more than 2% of total portfolio value on any single trade. Regardless of technical conviction, black swan market distributions can always materialize.
Enforce Maximum Portfolio Drawdown Limits
Implement circuit breakers: If portfolio drawdown exceeds 6% in a week or 10% in a month, pause trading for 3 days to reset psychology, audit trade journals, and eliminate revenge trading impulses.
Avoid Low-Float Assets Without Proven Cash Flow
Refrain from long-term capital allocation into tokens with circulating supply below 20% unless the project demonstrates verified on-chain revenue sharing.
Automate Pattern Recognition & Structural Invalidation Points
Leverage intelligent tools like GEM Scanner to automatically monitor 24 real-time candlestick and liquidity patterns, determining precise mathematically backed entry and stop levels without the emotional strain of manual screen watching.
RESEARCH DATA & CITATION DIRECTORY (20 OFFICIAL SOURCES)
DISCLAIMER: This report is conducted purely for market research, on-chain capital telemetry, and macroeconomic structural analysis for financial education purposes. It does not constitute and should not be construed as investment advice, financial recommendations, or an endorsement to buy or sell any digital assets or derivative instruments. All capital allocation decisions remain the sole responsibility of individual investors. Digital asset markets carry high volatility; always maintain strict risk management and trade only with capital you can afford to lose.
Escape Liquidity Traps,
Survive & Compound Through Every Market Cycle!
Do not trade on emotion amidst supply avalanches and liquidation cascades. Master actionable strategies with the Trading Starter course and deploy automated pattern recognition with GEM Scanner to protect your capital.