Dissecting Derivatives Volume & Open Interest Leverage: Identifying Sharp Reversal Inflection Points & Market-Wide Short Squeeze Traps
Dissecting Derivatives Volume & Open Interest Leverage: Identifying Sharp Reversal Inflection Points & Market-Wide Short Squeeze Traps
Comprehensive breakdown of perpetual futures leverage architecture, forced liquidation mechanics, Open Interest vs Volume correlation matrix, and institutional market maker liquidity hunting tactics.

📑 Executive Table of Contents
01. Dissecting the Core Nature of Derivatives Volume & Hidden Leverage Forces
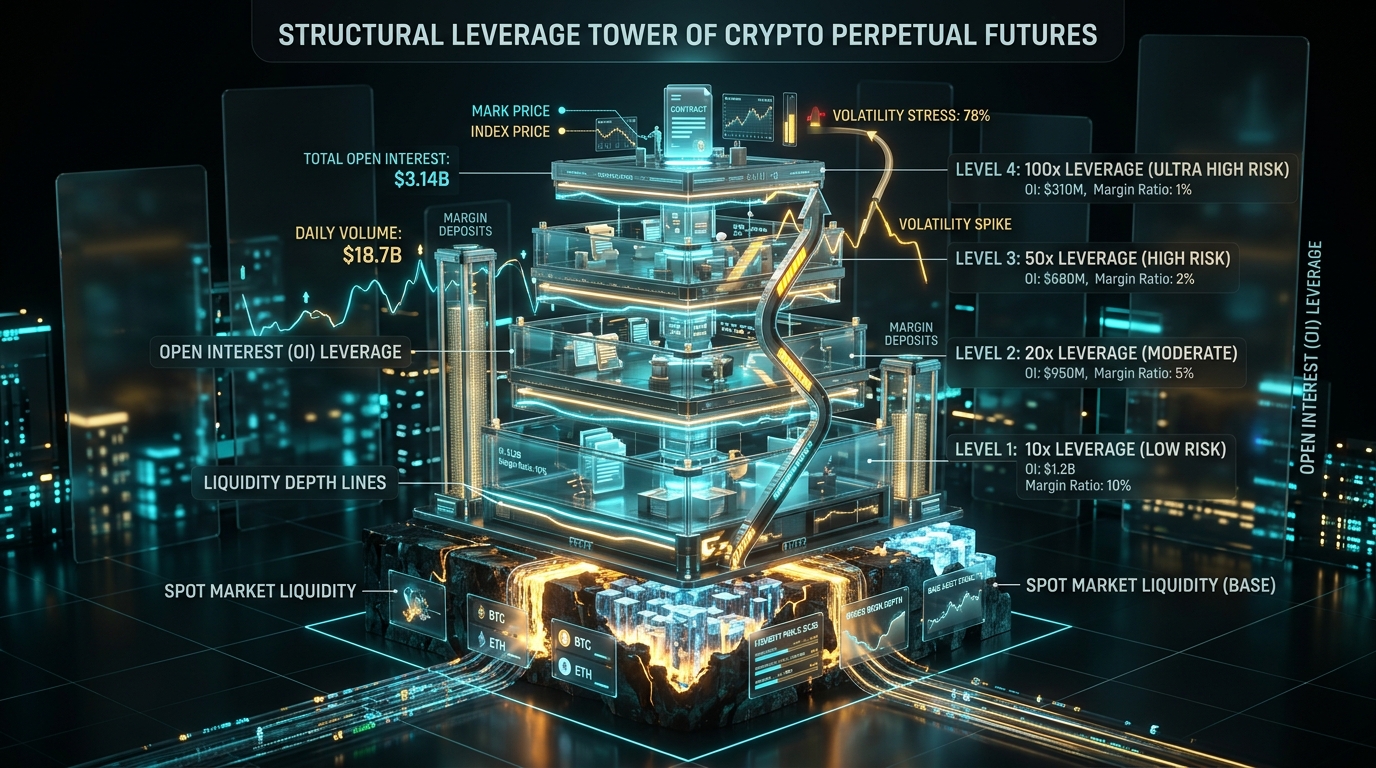
In modern financial market microstructure—particularly within digital asset markets—spot trading volume accounts for a modest 15% to 20% of aggregate daily liquidity turnover. The remaining 80%+ is utterly dominated by derivatives, specifically perpetual futures and options. This severe structural asymmetry transforms the market into a colossal leverage arena, where underlying spot pricing is continuously driven by leveraged liquidation cascades rather than genuine spot supply and demand.
Most retail market participants approach price charts with naive optimism: spotting a tall green candlestick on the 1-hour or 4-hour timeframe, they instantly conclude that 'bullish demand is unstoppable.' However, if that candlestick was fueled by 90% leveraged perpetual contracts at 20x, 50x, or 100x leverage rather than organic spot accumulation, that entire upward surge is nothing more than a castle built on shifting sands. When rallies are powered solely by synthetic leverage, even minor downward wicks trigger chain-reaction margin liquidations, erasing hours of gains within minutes.
The core reality of perpetual futures is that zero underlying physical tokens ever change custody when trades execute. Counterparties merely wager on price delta using fractional margin collateral. When aggregate market-wide leverage surges to 20x or 50x, an adverse price move of just 2% to 5% instantly triggers mandatory exchange liquidations into thin order books. Thus, isolating the ratio between spot volume and derivatives volume is the fundamental prerequisite for distinguishing genuine organic expansion from an engineered liquidity trap.
"Derivatives create zero intrinsic value for underlying assets; they act merely as an amplifier of human greed and terror. High leverage is the crowd's swiftest capital incinerator and the primary liquidity engine feeding institutional market-making algorithms."

02. Open Interest Dynamics: Genuine Capital Inflow vs Illusionary Debt Trap?
Open Interest (OI) quantifies the aggregate nominal value and contract count of active derivatives positions (unsettled, unclosed, and unliquidated) across leading tier-1 exchanges such as Binance, Bybit, OKX, and Deribit. Unlike 24h Trading Volume which merely logs historical transaction turnover, Open Interest directly reveals the exact quantum of capital and systemic risk currently trapped within live order books.
When Open Interest surges while Bitcoin or Ethereum consolidates within a compressed range, it signals that both long and short aggressive participants are stacking massive margin leverage against one another. This represents the ultimate coiled-spring regime in quantitative derivatives analysis: billions in liquidation fuel are tightly packed, requiring only a modest catalytic liquidity impulse to violently trigger an explosive volatility expansion that vaporizes one side of the book.
A critically underappreciated institutional metric is the Open Interest to Market Capitalization Ratio. When this ratio breaches historical danger thresholds (typically exceeding 3.5% to 4.0% for Bitcoin), the market enters an Overleveraged Regime. Here, price swings cease to reflect fundamental value discovery, devolving entirely into high-frequency algorithmic liquidity extraction battles.
Fresh leveraged capital is aggressively entering long positions. The uptrend retains strong short-term momentum, yet the systemic risk of a devastating Long Squeeze compounds exponentially as the slope of the OI curve turns vertical.
Aggressive shorts are pouring heavy capital into bearish bets. Synthetic sell-side pressure dominates the order book, laying extensive dry powder for a massive Short Squeeze should price tap institutional structural support.
03. Perpetual Funding Rates & Herd Psychology: The Market Sentiment Thermometer
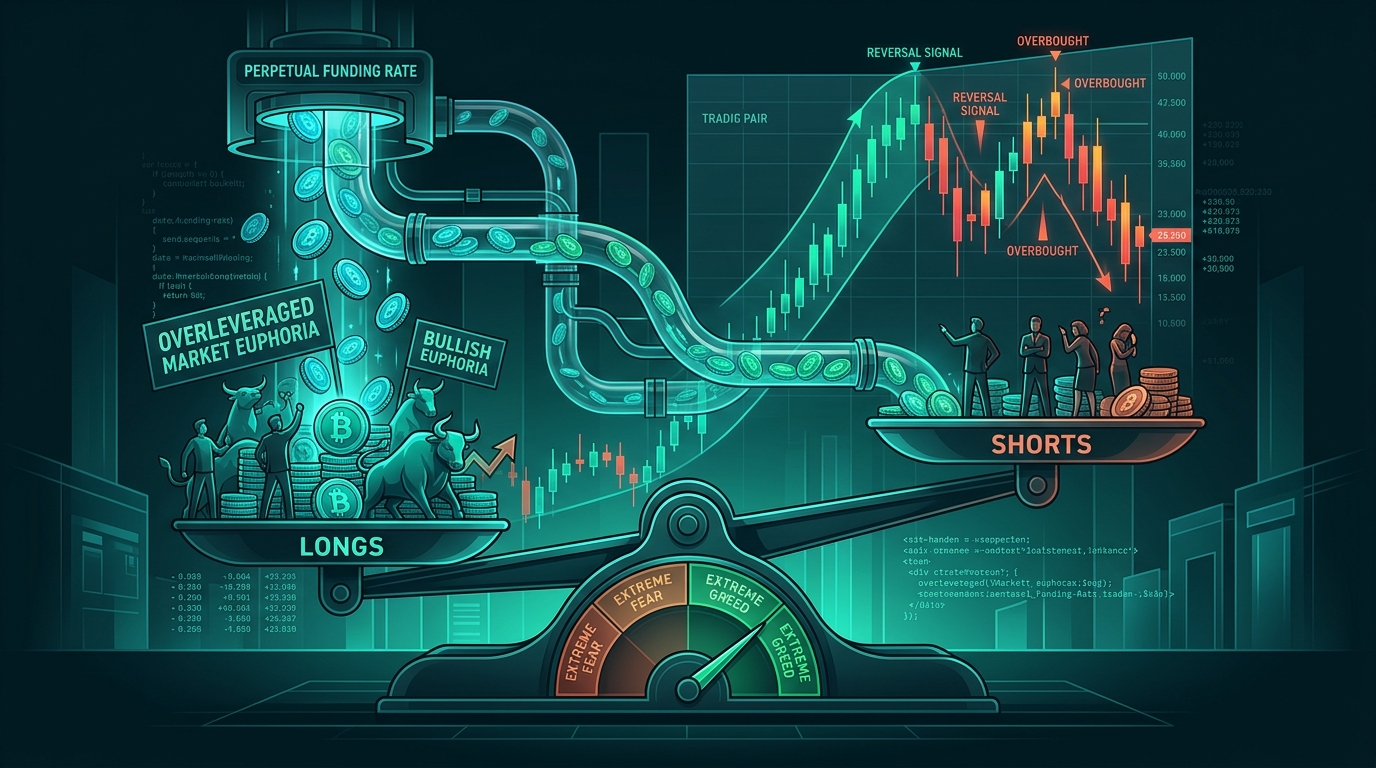
The Funding Rate mechanism is the fundamental structural innovation that tethers perpetual futures contracts to spot index valuations. Because perpetuals lack fixed settlement dates, exchanges mandate peer-to-peer funding transfers every 8 hours (or dynamically shortened to 4h/1h during extreme volatility) to rebalance order book imbalances between long and short speculators:
- High Positive Funding Rate (> +0.05% to +0.10% per 8h cycle): Longs hold overwhelming positioning and pay hefty continuous cash tolls to shorts to hold their exposure. This signals extreme speculative herd euphoria (Extreme Greed).
- Deep Negative Funding Rate (< -0.05% to -0.15% per 8h cycle): Shorts are aggressively crowding the downside, continuously paying funding fees to longs. The market is gripped by extreme panic (Extreme Fear), heavily discounting the asset below equilibrium value.
A classic psychological trap leading to recurring retail ruin is naive trend-following: 'High positive funding means everyone is bullish, so I should long.' In reality, when funding reaches unsustainable extremes, the carrying cost of holding leverage becomes debilitating. Even a minor spot downdraft triggers panic closing from fragile longs, offering market makers the perfect setup to engineer a deep liquidation cascade.
04. Liquidation Heatmaps & The Art of Institutional Liquidity Hunting
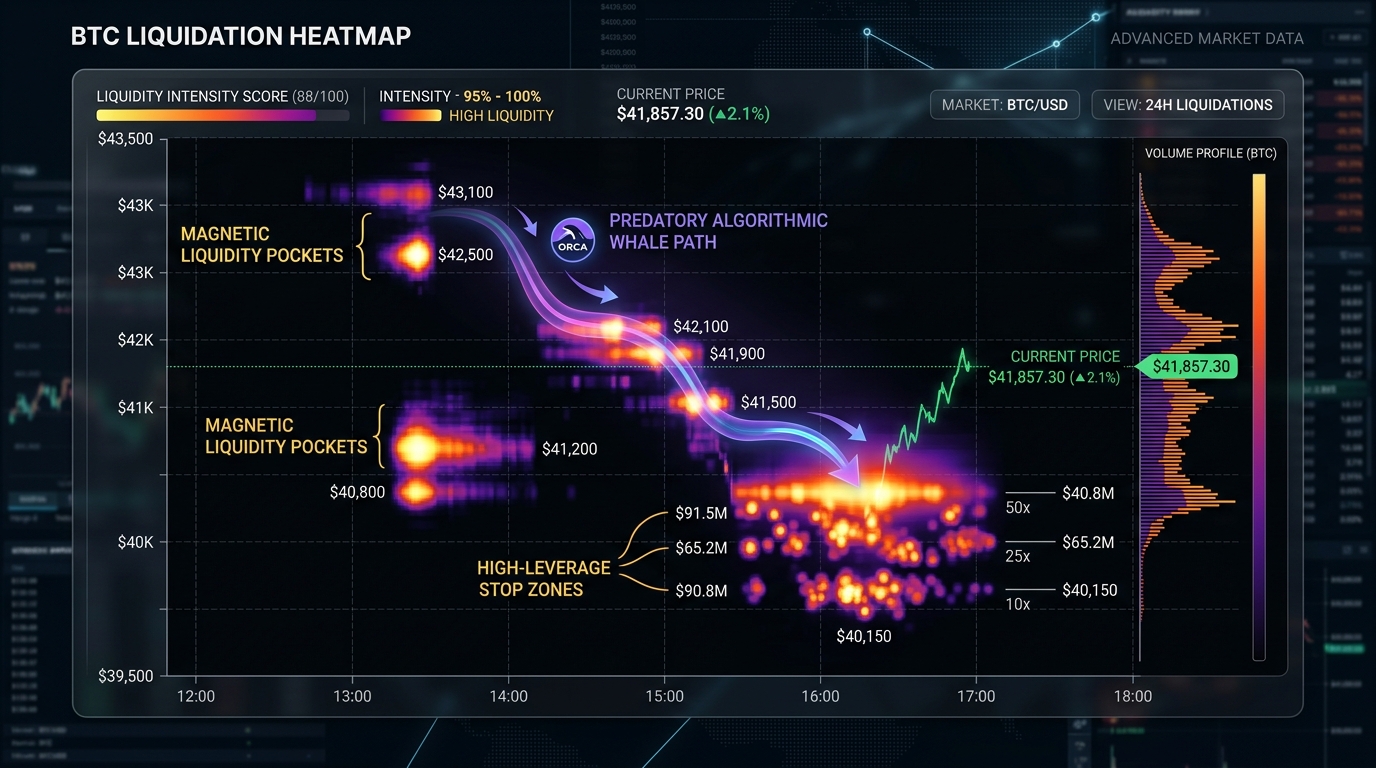
In derivatives trading, price action is never random and rarely respects simplistic lagging indicators like RSI or MACD. Price acts as a dynamic entity relentlessly drawn toward concentrated pools of resting liquidity. A Liquidation Heatmap is a quantitative visualization modeling exact price coordinates where hundreds of millions in leveraged positions will suffer forced margin liquidations.
Institutional algorithmic execution desks treat liquidation clusters as prime liquidity fuel. When an institutional desk needs to accumulate 5,000 BTC without paying massive market slippage, their optimal path is driving price into concentrated Long liquidation zones. As thousands of retail longs are forcibly liquidated via market sell orders, the institution absorbs the panic volume at a steep discount, creating legendary liquidity pinbars.
Mastering liquidation heatmaps shifts your operational perspective from prey to predatory observer: instead of clustering your stop-losses with the retail herd, you patiently await the institutional sweep before deploying capital in alignment with true smart money order flow.
05. Decoding the Short Squeeze Nightmare: Chain-Reaction Dynamics & Sell-Side Liquidity Evaporation
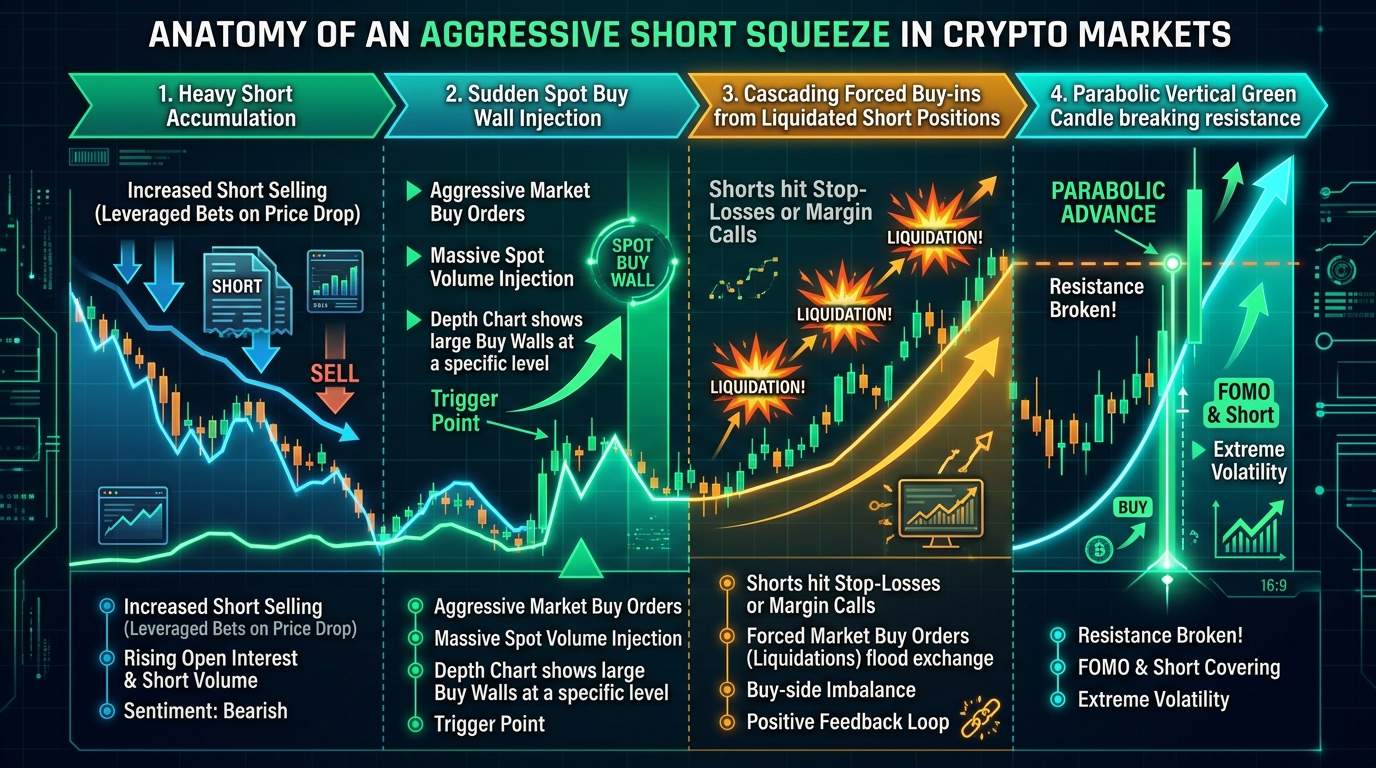
A Short Squeeze represents one of the most violent and spectacular volatility events in financial market history. Fundamentally, a short position entails borrowing an asset to sell at current prices, with the contractual obligation to repurchase those exact units in the future to settle the debt.
When market sentiment sinks into pervasive despair, retail crowds pile into high-leverage short positions, driving funding rates deep into negative territory. This leaves the overhead ask book completely hollowed out. A classic Short Squeeze unfolds through four precise mechanical phases:
06. The 4-State Correlation Matrix: Price Action, Volume & Open Interest
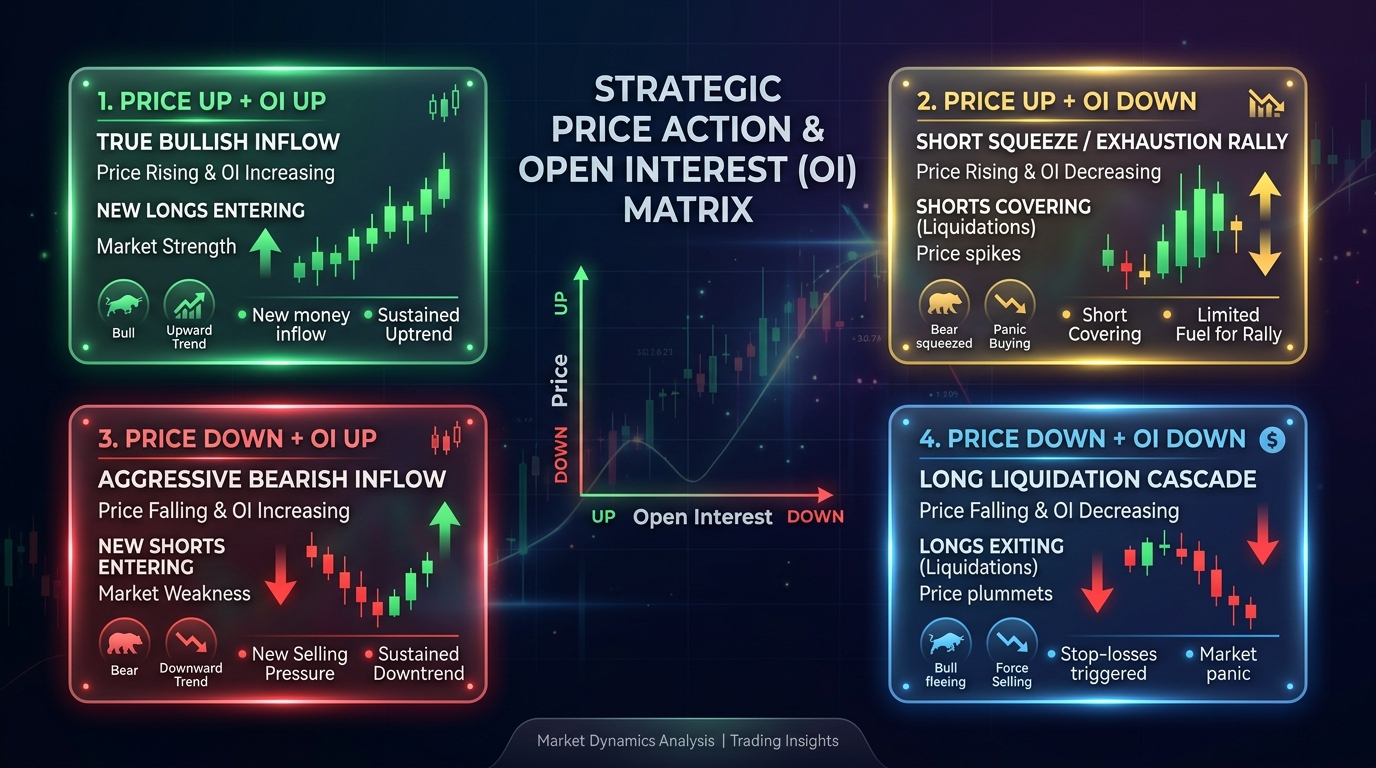
To achieve structural clarity and avoid false candlestick traps, professional quantitative desks analyze three interlocked variables in unison: Price Action, Volume, and Open Interest across this canonical four-quadrant matrix:
| Price Action | Open Interest (OI) | Trading Volume | Underlying Capital Flow Reality | Strategic Execution Rule |
|---|---|---|---|---|
| RISING ▲ | RISING ▲ | RISING ▲ | True Bullish Expansion: Fresh institutional spot and long capital entering. Buyers firmly command order flow. | Ride the trend; trail stop-losses along ascending market structure. |
| RISING ▲ | FALLING ▼ | VOLUME SPIKE | Short Squeeze / Exhaustion Rally: Upside driven purely by short liquidations rather than fresh buying. | Do not FOMO into the vertical wick; scale out and take partial profits on longs. |
| FALLING ▼ | RISING ▲ | RISING ▲ | Bearish Expansion: Aggressive synthetic selling and short leverage flooding the books. | Never catch falling knives; wait for verifiable seller exhaustion signals. |
| FALLING ▼ | FALLING ▼ | VOLUME SPIKE | Long Liquidation Cascade: Long leverage flushed out in a violent cascading liquidation sweep. | Await full liquidation completion and reversal confirmation before entering high R:R setups. |
07. Red Teaming: 5 Fatal Traps Retail Traders Face When Analyzing Derivatives Data
A rigorous Red Teaming stress-test exposes five catastrophic cognitive flaws causing retail traders to blow accounts when misinterpreting derivatives metrics:
1. Conflating Account Headcount Ratios with Real Capital Volume Ratios
Traders often see a 75% Long Account Ratio and prematurely short the market. They fail to recognize that 75% of accounts might hold just $15M in retail capital, while the 25% short accounts represent $300M in institutional smart money. Capital weight dictates market direction, not participant headcount.
2. Ignoring Disconnects Between Spot Order Books and Perpetual Futures
When futures surge while spot volume across institutional exchanges (Coinbase, Kraken) remains dormant, you are observing a Pure Paper Rally. The subsequent mean-reversion liquidation dump is often brutal, completely erasing the entire move.
3. Fighting Dominant Trends Based Purely on Elevated Funding Rates
During parabolic macro expansions, funding rates can persist at record highs for 3-4 consecutive weeks while asset prices double. Shorting into the teeth of a macro freight train simply because funding is elevated reflects profound structural ignorance.
4. Placing Stop-Loss Orders Inside Obvious High-Density Liquidation Pools
Placing stops just below obvious swing lows or psychological round numbers hands your capital directly to exchange market-maker algorithms. Quantitative stops must be volatility-adjusted via Average True Range (ATR) and anchored outside standard liquidity sweep thresholds.
5. Operating in Lower-Timeframe Isolation Without Higher-Timeframe Structural Context
Spotting a 5-minute short squeeze trigger while remaining blind to a massive 1D/1W macro distribution supply zone is financial suicide. Executing lower-timeframe signals in opposition to higher-timeframe order flow guarantees slow account bleed.
08. 4-Step Protocol for Integrating Derivatives Signals into a Robust Trading Edge
To establish a verifiable quantitative edge and avoid getting trapped in liquidation crossfire, execute this standardized four-step institutional trading routine:
Map institutional Supply/Demand zones, spot cumulative volume delta, and macro liquidity pools. Never open risk without alignment with higher-timeframe order flow.
Use real-time liquidation heatmaps to pinpoint concentrated stop clusters above and below consolidation zones, identifying high-probability wick targets.
As price penetrates liquidation clusters, monitor whether Open Interest expands or contracts. A sharp drop in OI following a wick confirms leveraged weak hands have been thoroughly wiped.
Deploy capital only upon automated confirmation from the GEM Scanner engine. Enforce strict risk sizing, capping stop-loss loss limits to 1.5% - 2.0% of total equity per trade.
Strategic Trading Arsenals & Institutional Masterclasses
Engineered from battlefield trading experience, designed to protect your capital and navigate institutional market flow.
Derivatives Audit Checklist & Capital Preservation Risk Calculator
An automated spreadsheet pre-configured for ATR-based position sizing, funding rate break-even modeling, and a 10-point pre-flight order execution audit.
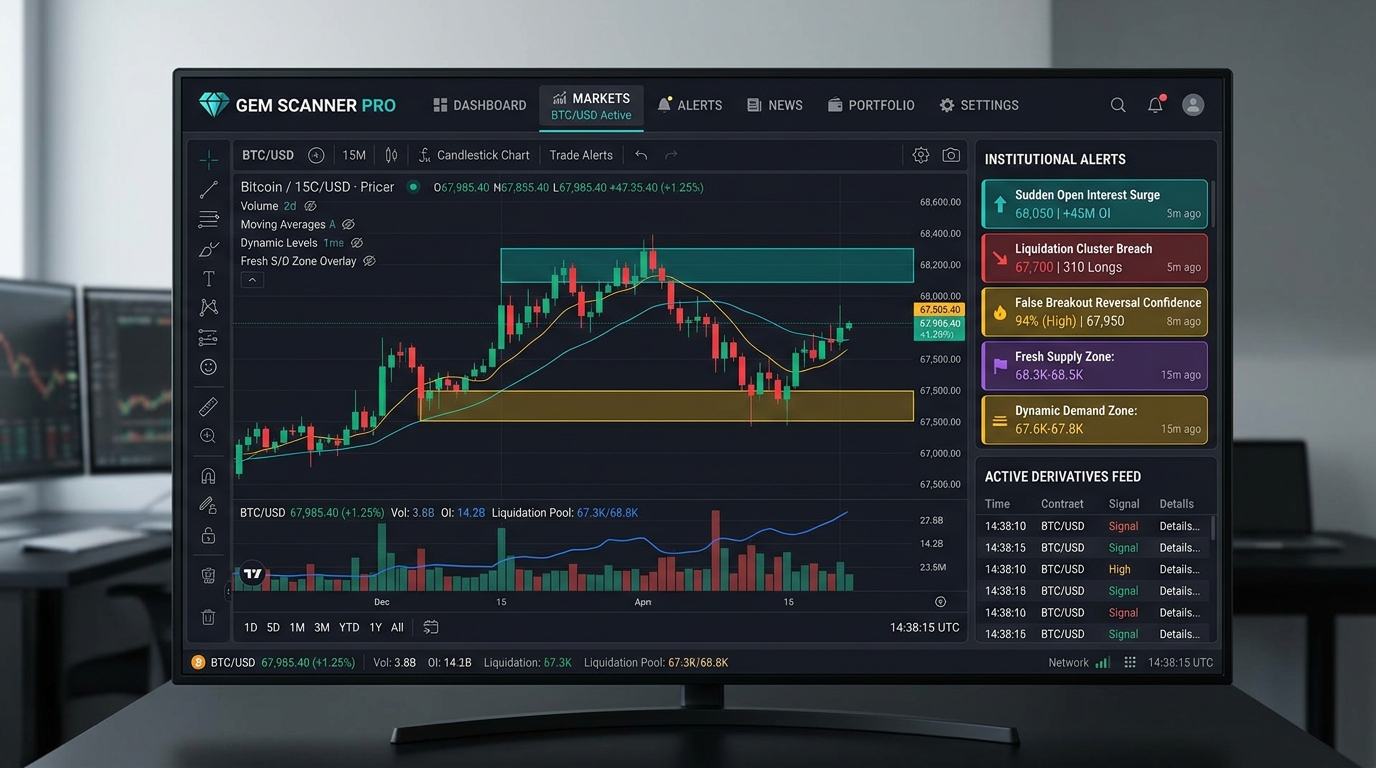
GEM Scanner PRO: Real-Time Flow & Liquidity Radar
Autonomously scans Open Interest compression zones, detects derivatives volume divergences, and alerts predatory liquidation sweeps 24/7.
Crypto From Ground Zero: 21 Days to Bulletproof Capital Preservation
A comprehensive roadmap mastering market mechanics, identifying exchange manipulation traps, and establishing lifelong survival discipline.
AI Monetization: 30 Days to 6 Autonomous Departments
Deploy an end-to-end autonomous AI system for market research, on-chain flow tracking, and daily executive briefing generation.
10. Key Takeaways & Strategic Verdict on Capital Preservation & Discipline
Volume Never Lies, But Leverage Always Deceives: A sustainable expansion requires organic spot capital inflow. When price and Open Interest surge while spot volume dries up, an engineered liquidation dump is imminent.
Liquidity is the Universal Market Magnet: Market makers relentlessly hunt resting stops modeled on Liquidation Heatmaps to fill institutional orders. Learn to align with smart money sweeps rather than serving as exit liquidity.
Respect the Inviolable Laws of Probability: No indicator offers 100% certainty. Quantitative risk management, strict position sizing, and capital preservation are the only mathematical keys to enduring generational wealth creation.
"In the ruthless arena of derivatives, the true victor is never the one who chases ephemeral overnight riches, but the disciplined strategist who maintains cold composure, protects principal at all costs, and endures to capture generational market opportunities."
11. Academic Bibliography, On-Chain Intelligence Sources & Global Research
- Hull, J. C. (2022). Options, Futures, and Other Derivatives (11th ed.). Pearson Education.
- Alexander, C., & Heck, D. F. (2020). Price discovery in Bitcoin: Spot or derivatives?. Journal of International Money and Finance, 108, 102247.
- Shleifer, A., & Vishny, R. W. (1997). The Limits of Arbitrage. The Journal of Finance, 52(1), 35-55.
- Brunnermeier, M. K., & Pedersen, L. H. (2009). Market Liquidity and Funding Liquidity. The Review of Financial Studies, 22(6), 2201-2238.
- Kyle, A. S. (1985). Continuous Auctions and Informed Trader Behavior. Econometrica, 53(6), 1315-1335.
- Glassnode Insights. (2026). Perpetual Futures Market Dynamics and Open Interest Stress Index. Glassnode On-Chain Intelligence Report.
- CryptoQuant Analytics. (2026). Exchange Reserves and Estimated Leverage Ratio in Cryptocurrency Derivatives. CryptoQuant Institutional Data.
- Coinglass Research. (2026). Liquidation Heatmaps and Orderbook Depth Imbalances in High-Volatility Regimes. Coinglass Market Pulse.
- Binance Research. (2025). The Mechanics of Perpetual Funding Rates in Crypto Markets. Binance Global Macro Insights.
- Fama, E. F. (1970). Efficient Capital Markets: A Review of Theory and Empirical Work. The Journal of Finance, 25(2), 383-417.
- Black, F. (1986). Noise. The Journal of Finance, 41(3), 528-543.
- Grossman, S. J., & Stiglitz, J. E. (1980). On the Impossibility of Informationally Efficient Markets. The American Economic Review, 70(3), 393-408.
- Biais, B., Hillion, P., & Spatt, C. (1995). An Empirical Analysis of the Limit Order Book and the Order Flow in the Paris Bourse. The Journal of Finance, 50(5), 1655-1689.
- Hasbrouck, J. (1991). Measuring the Information Content of Stock Trades. The Journal of Finance, 46(1), 179-207.
- O'Hara, M. (1995). Market Microstructure Theory. Blackwell Publishers.
- Bank for International Settlements (BIS). (2024). Financial Stability and Leverage in Cryptoasset Derivative Markets. BIS Working Papers No. 1184.
- International Monetary Fund (IMF). (2025). Global Financial Stability Report: Navigating Systemic Risks in Digital Asset Derivatives. IMF Publications.
- Kaiko Research. (2026). Market Depth and Liquidity Fragility in Crypto Perpetual Contracts. Kaiko Data Insights.
- Natenberg, S. (2014). Option Volatility and Pricing: Advanced Trading Strategies and Techniques. McGraw-Hill Education.
- GEMRAL Quantitative Research Lab. (2026). Multi-Timeframe Derivative Anomaly Detection and Structural Liquidity Architecture. Gemral Internal Whitepaper.