Multi-Timeframe Analysis: Decoding 4H vs 1D Signal Conflicts & Smart Money Liquidity Maps
Multi-Timeframe Analysis:
Decoding 4H vs 1D Signal Conflicts & Smart Money Liquidity Maps
Unpacking why most retail traders fall into distribution traps, market maker Stop Loss hunting mechanisms, and the 3-step multi-timeframe synchronization matrix to preserve capital and optimize Risk:Reward ratios.
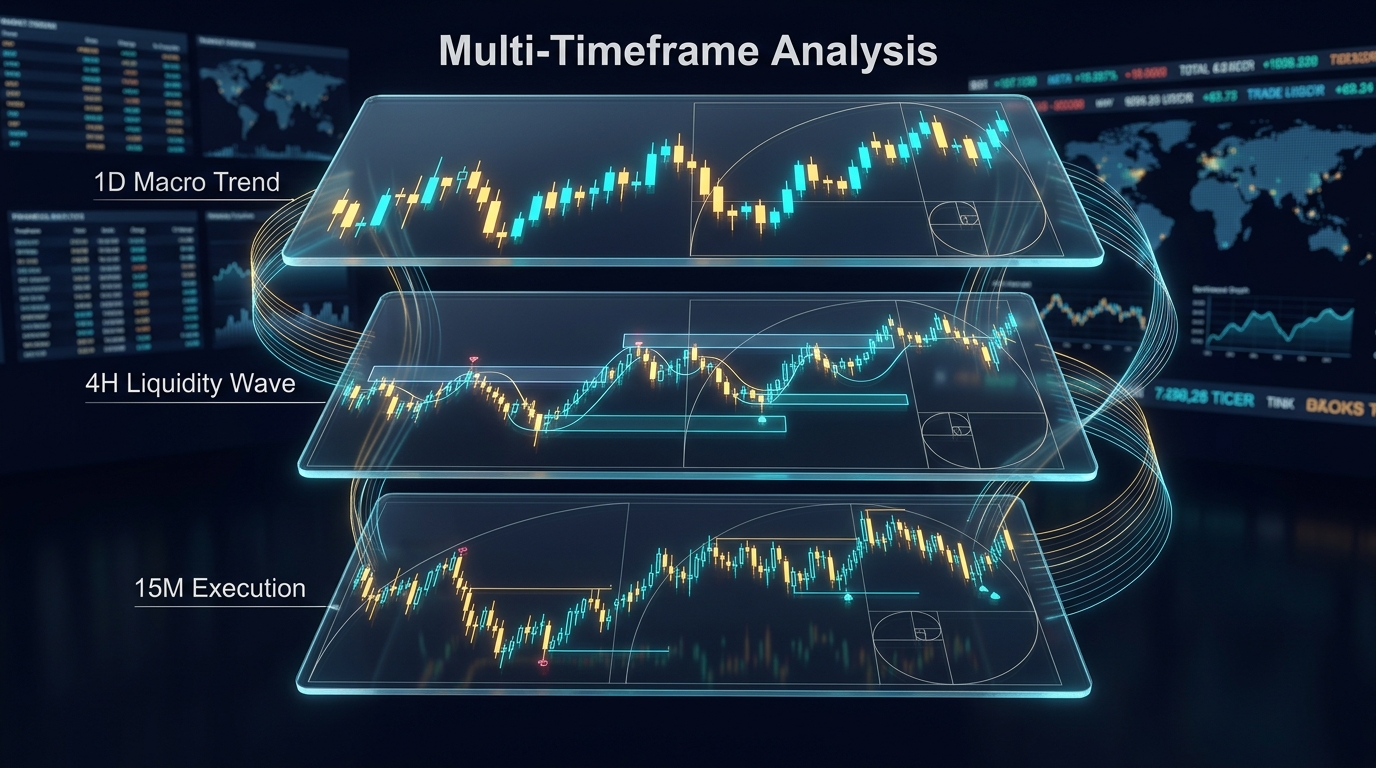
Figure 1: 3-Tier Multi-Timeframe Architecture — 1D Macro Structure, 4H Liquidity Waves, and 15M Execution Triggers.
Executive Strategy Summary & Core Theses
- The Nature of Microscopic Illusions: Bullish breakout candle signals on the 4H timeframe often merely reflect a technical pullback wave or liquidity sweep trap colliding directly into the Daily Order Block resistance zone.
- Smart Money Liquidity Map: Institutional market makers aggressively target concentrated Stop Loss clusters resting above/below lower timeframe swing points to fill massive institutional orders for macro positions.
- 3-Tier Execution Rule: Professional traders strictly anchor overall trend bias to the Daily (1D) timeframe, identify liquidity imbalances on the 4H timeframe, and execute sniper entries on the 15M timeframe upon confirmed structural shifts.
1. WHY 85% OF TRADERS SUFFER LOSSES FROM COUNTER-TREND WAVES
In his seminal masterwork on strategic power, author Robert Greene observed a profound truth: humanity's most catastrophic failures stem from becoming trapped in myopic immediate fluctuations while remaining blind to the overarching macro laws governing the battlefield. In cryptocurrency derivatives and financial markets, this observation perfectly explains why the vast majority of retail traders suffer recurring capital destruction.
Consider a typical scenario occurring daily across markets: A trader analyzes Bitcoin or Ethereum on the 4-hour chart. The chart prints a series of three consecutive long-bodied green breakout candles, the 20 EMA crosses above the 50 EMA, RSI surges past 60, and volume spikes dramatically. Conventional technical indicators uniformly scream 'Strong Buy'. Driven by fear of missing out (FOMO), the trader opens an aggressive leveraged Long position. Yet within hours, a massive red engulfing candle plunges down and wipes out their entire margin capital.
The root cause of this loss lies in the complete absence of macro situational awareness. The 4H buy signal triggered precisely as price collided directly into a massive Daily Bearish Order Block within an overarching Daily downtrend. Buying here is mathematically equivalent to paddling a small canoe against a surging tidal wave.
Financial markets operate on a Fractal Market Structure. Every timeframe is intrinsically nested within another. A single Daily candle contains six 4-Hour candles, 24 1-Hour candles, and 96 15-Minute candles. When these timeframes broadcast conflicting signals, traders anchored exclusively to lower timeframes inevitably become liquidity fodder for institutional players commanding the higher timeframe map.
Behavioral finance research from the University of California demonstrates that over 90% of retail traders consult only a single timeframe when executing trades. This single-frame fixation creates fatal cognitive blindspots: traders fail to detect macro resistance barriers, concentrated futures liquidation pools, and subtle Wyckoff accumulation/distribution campaigns orchestrating on higher planes.
2. MULTI-TIMEFRAME ARCHITECTURE (HTF VS LTF): THE LIGHTHOUSE & TIDAL CURRENT PRINCIPLE
To construct an enduring statistical edge, quantitative funds and institutional trading desks organize market timeframes into three distinct hierarchical tiers:
1. High Timeframe HTF (1W / 1D)
Acts as the navigational lighthouse. Establishes macro structural bias, dominant long-term trends, fundamental supply/demand zones, and genuine institutional liquidity boundaries.
2. Intermediate Timeframe ITF (4H / 1H)
Acts as tidal wave currents. Reveals technical pullback trajectories, Fair Value Gaps (FVG), and liquidity engineering traps being actively laid out.
3. Low Execution Timeframe LTF (15M / 5M)
Acts as the sniper trigger. Monitors granular micro price action, detects Market Structure Shifts (MSS / CHoCH), and compresses Stop Loss distance to maximize Risk:Reward geometry.

Figure 2: Correlation Architecture between Higher Timeframes (Guiding Lighthouse) and Lower Timeframes (Agile River Currents).
The overarching governing law: Higher timeframes continuously dominate and encompass all lower timeframe sub-structures. An explosive rally on the 15-minute or 4-hour chart remains merely a temporary ripple within a broader macro Daily distribution cycle.
When the Daily structure is decidedly bearish, all 4H bottoming attempts must be scrutinized with extreme skepticism. Only when price reaches a deep Discount Zone below 50% of the Daily dealing range do lower timeframe reversal patterns carry genuine statistical significance.
3. CONFLICT ANATOMY: WHEN 4H BULLISH BREAKOUTS COLLIDE WITH DAILY ORDER BLOCKS
To dissect why aggressive 4H breakout candles suffer sudden violent reversals, we must examine the mechanics of a Daily Order Block (OB).
On higher timeframes, when institutions need to liquidate tens of thousands of Bitcoin, executing market orders would trigger severe slippage and crash their own exit price. Instead, institutional algorithms stack massive Limit Sell matrices across macro liquidity pools. This concentrated selling footprint forms a Daily Bearish Order Block.
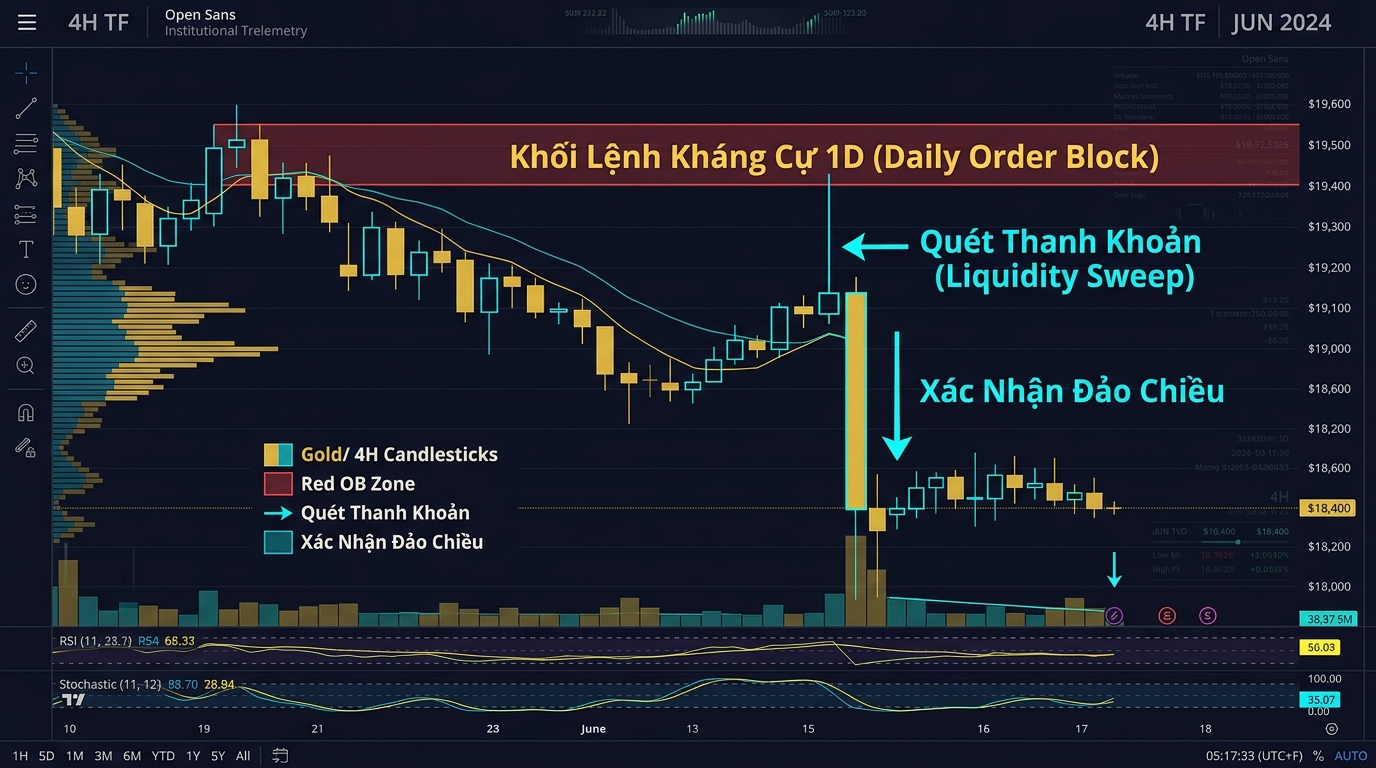
Figure 3: Close-up of 4H price action printing an aggressive Liquidity Sweep wick directly into Daily Resistance before a sharp collapse.
As price rallies on the 4H chart, emotional retail traders observe higher lows and aggressively chase the momentum. The moment price pierces above the previous 4H swing high, breakout buy stops trigger en masse, alongside the automatic execution of short-seller stop losses (which are mathematically buy orders).
This sudden surge of retail buying liquidity provides the ideal counterparty volume for institutions to completely fill their massive Daily Limit Sell orders. The instant retail buying dries up, price collapses under gravitational selling pressure, leaving behind an elongated 4H wick characteristic of a textbook Liquidity Sweep.
This dynamic is further reinforced by Fair Value Gaps (FVG). When price drops aggressively on the Daily chart, it creates large liquidity imbalances. The 4H counter-trend rally is simply the market's natural mechanism rebalancing this inefficiency before resuming the primary downward trend.
4. SMART MONEY LIQUIDITY DYNAMICS: MECHANICS OF LOWER TIMEFRAME LIQUIDITY SWEEPS
Liquidity represents the lifeblood of financial markets. Without sufficient resting liquidity, institutional capital cannot rotate hundreds of millions of dollars without incurring crippling market impact costs.

Figure 4: The contrast between calculated institutional Smart Money deployment and chaotic emotional retail crowd trading.
Lower timeframes (1H, 15M, 5M) serve as the primary execution ground where market maker algorithms engineer liquidity. Two primary liquidity pools are perpetually targeted:
1. Buy-Side Liquidity (BSL)
Rests above equal highs or prominent swing highs on the 4H and 1D charts. Contains dense clusters of short-seller stop losses and breakout buy stops. Market makers manipulate price just above these highs to harvest exit liquidity before engineering sharp reversals.
2. Sell-Side Liquidity (SSL)
Rests below equal lows or previous weekly lows. Contains clusters of long stop losses and panic market sell orders. Smart money pushes price below these support levels to trigger cheap liquidation volume and accumulate inventory for the next markup phase.
Understanding liquidity mapping eliminates confusion when price violently pierces a major support level only to instantly reverse upwards. That signature represents the unmistakable footprint of a completed Sell-Side Liquidity Sweep.
5. DERIVATIVES LIQUIDATION HEATMAPS & CROSS-TIMEFRAME ORDER FLOW DELTA
Rather than relying on lagging indicators, professional desks monitor real-time Derivatives Liquidation Heatmaps paired with Cumulative Volume Delta (CVD).
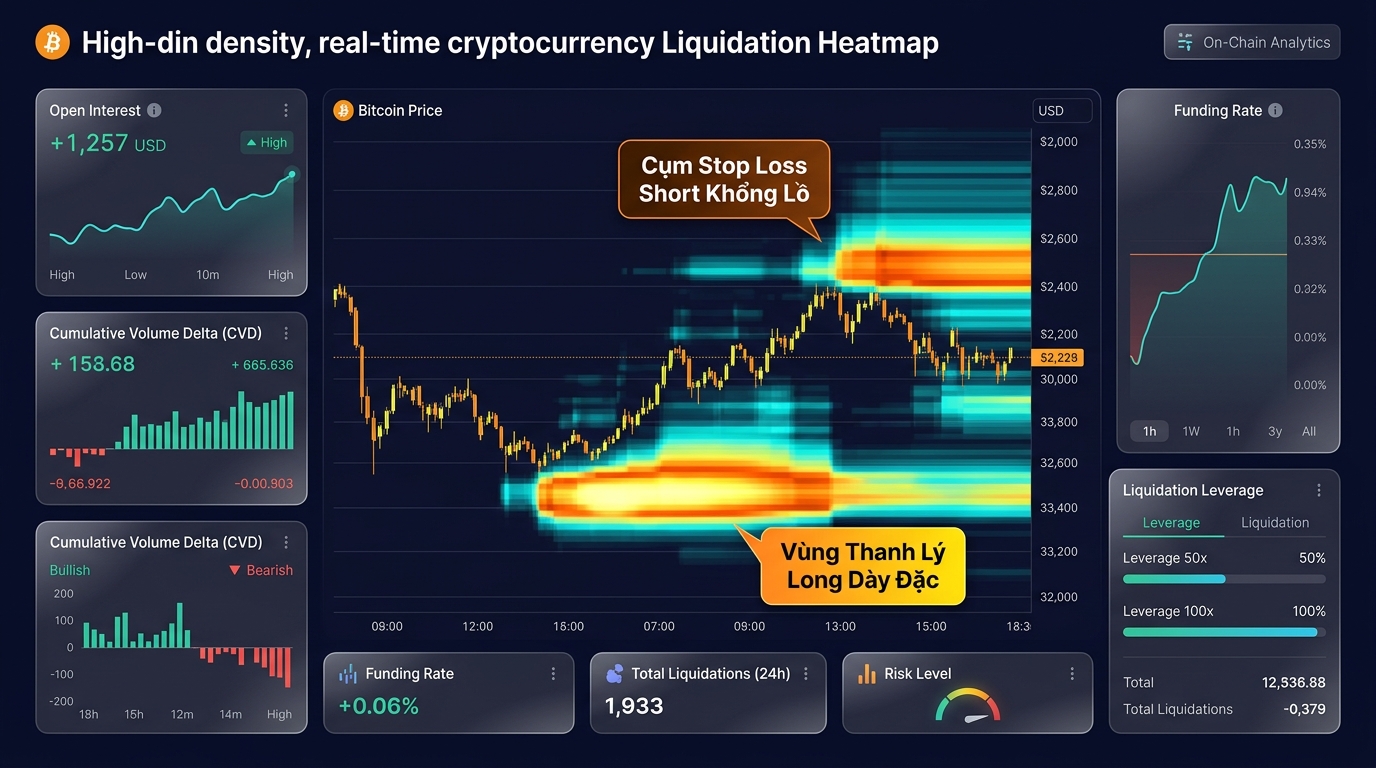
Figure 5: Real-time derivatives liquidation heatmap exposing concentrated long and short liquidation clusters.
The fundamental law of market motion: Price gravitated towards zones of highest liquidation density. During Daily consolidation periods when 4H charts display erratic volatility, futures leverage metrics spike rapidly. Vivid heatmap clusters reveal price points where hundreds of millions of dollars in leveraged positions face forced liquidation.
When algorithms identify massive long liquidation clusters situated just beneath fragile support shelves, a minor 4H push triggers a cascade of automated liquidations, pulling price down like an irresistible gravitational magnet.
Cumulative Volume Delta (CVD) provides unvarnished insight into true aggressive market orders: If price achieves higher highs on the 4H chart while CVD trends downward, it confirms that upward price motion is driven merely by temporary passive ask exhaustion rather than genuine buying demand — a textbook distribution divergence.
6. RED-TEAMING TOKENOMICS: THE 4H PUMP & 1D DUMP TRAP OF HIGH FDV / LOW FLOAT ALTCOINS
A critical institutional application of multi-timeframe analysis is independent forensic auditing (Red-Teaming) of altcoin tokenomics architectures.

Figure 6: Forensic analysis of high FDV / low float tokenomic traps engineered to dump unlocked supply on Daily charts.
In recent market cycles, a predatory structural trap has become widespread: Projects launch with multi-billion-dollar Fully Diluted Valuations (FDV) while floating an initial circulating supply of only 3% to 8%.
Mechanics of the Low-Float Distribution Engine:
- 4H Timeframe Mirage: Because circulating supply is constrained, market makers require minimal capital to pump spot prices 200% to 500% on 4H charts, manufacturing artificial hype.
- 1D Reality: While retail traders FOMO into 4H breakouts, venture capital cliff vesting schedules unlock hundreds of millions in tokens acquired at fractions of a cent, dumping relentless supply onto secondary markets.
- Actual Outcome: Daily and Weekly charts enter permanent, relentless downward trends despite dozens of deceptive short-term 4H relief rallies.
Sophisticated traders always cross-reference token unlock schedules. When monthly supply inflation exceeds 5% of circulating market cap, every 4H rally represents an optimal setup for systematic hedging or short rotation.
7. 3-STEP MULTI-TIMEFRAME MATRIX: FROM 1D BIAS TO 4H/15M SNIPER EXECUTION
To execute multi-timeframe analysis with systematic discipline, traders should implement this rigorous 3-step operational matrix:

Figure 7: 3-Step Execution Matrix linking Daily Macro Bias to 15M Sniper Execution.
At the start of each session, review the Daily chart: Is the macro structure Bullish, Bearish, or Range-bound? Where are the dominant Order Blocks and Fair Value Gaps located? Is price trading in the Premium (above 50% equilibrium) or Discount zone? Core Rule: Never initiate long positions within the Daily Premium zone.
Wait patiently for price to retrace against the Daily trend into key Daily zones. Closely monitor whether the 4H candle prints a Liquidity Sweep wick taking out previous swing points. Never enter before the 4H candle officially closes to confirm structural reaction.
Once price reaches the Daily zone and completes the 4H sweep, zoom into the 15M chart to detect a Market Structure Shift (MSS / CHoCH). Place a Limit entry at the newly formed 15M FVG with Stop Loss tucked behind the 4H sweep wick, unlocking asymmetric Risk:Reward ratios of 1:4 or higher.
This 3-step matrix acts as an institutional filter: Eliminating over 80% of daily market noise and focusing mental capital on 2 to 3 pristine, high-conviction trade setups each week.
8. STRUCTURAL STOP LOSS VS EMOTIONAL RISK MANAGEMENT
Setting arbitrary fixed percentage stop losses regardless of technical market structure is inherently flawed and mathematically unprofitable.
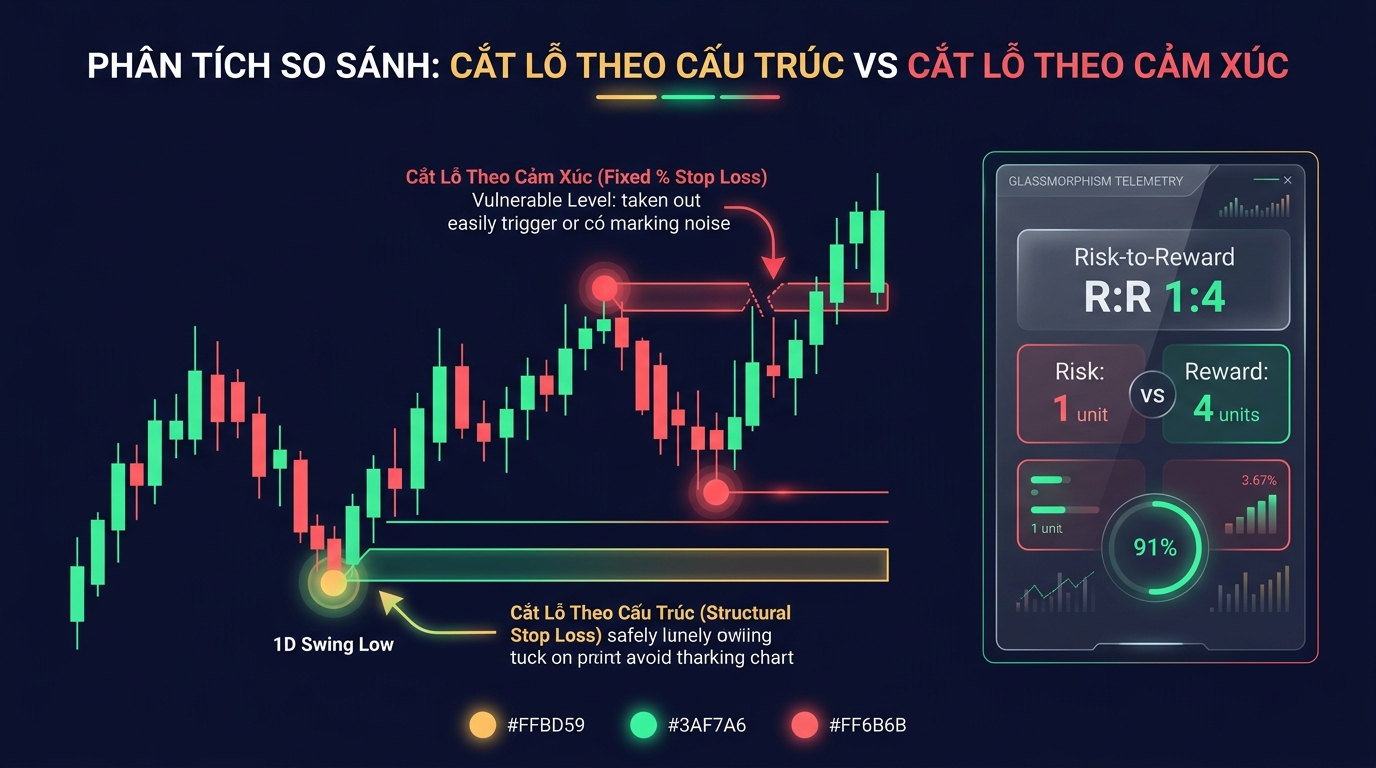
Figure 8: Comparative analysis of Structural Stop Loss placement vs vulnerable emotional fixed percentage stop losses.
Markets respect only Structural Invalidation Levels. A professional Stop Loss must be stationed where, if breached, the foundational analytical thesis is mathematically disproven.
After calculating exact structural invalidation distance, position size is determined via rigorous quantitative formulas:
If structural invalidation is $1,000 away on Bitcoin and maximum risk per trade is $200 (1% of a $20,000 account), position size must equal exactly 0.2 BTC. Mechanical risk management guarantees portfolio survival across volatile regimes.
9. FORENSIC CASE STUDY: BITCOIN & ETHEREUM MULTI-TIMEFRAME DIVERGENCES
Forensic examination of historical Bitcoin data demonstrates the immense market consequences of cross-timeframe structural divergences.
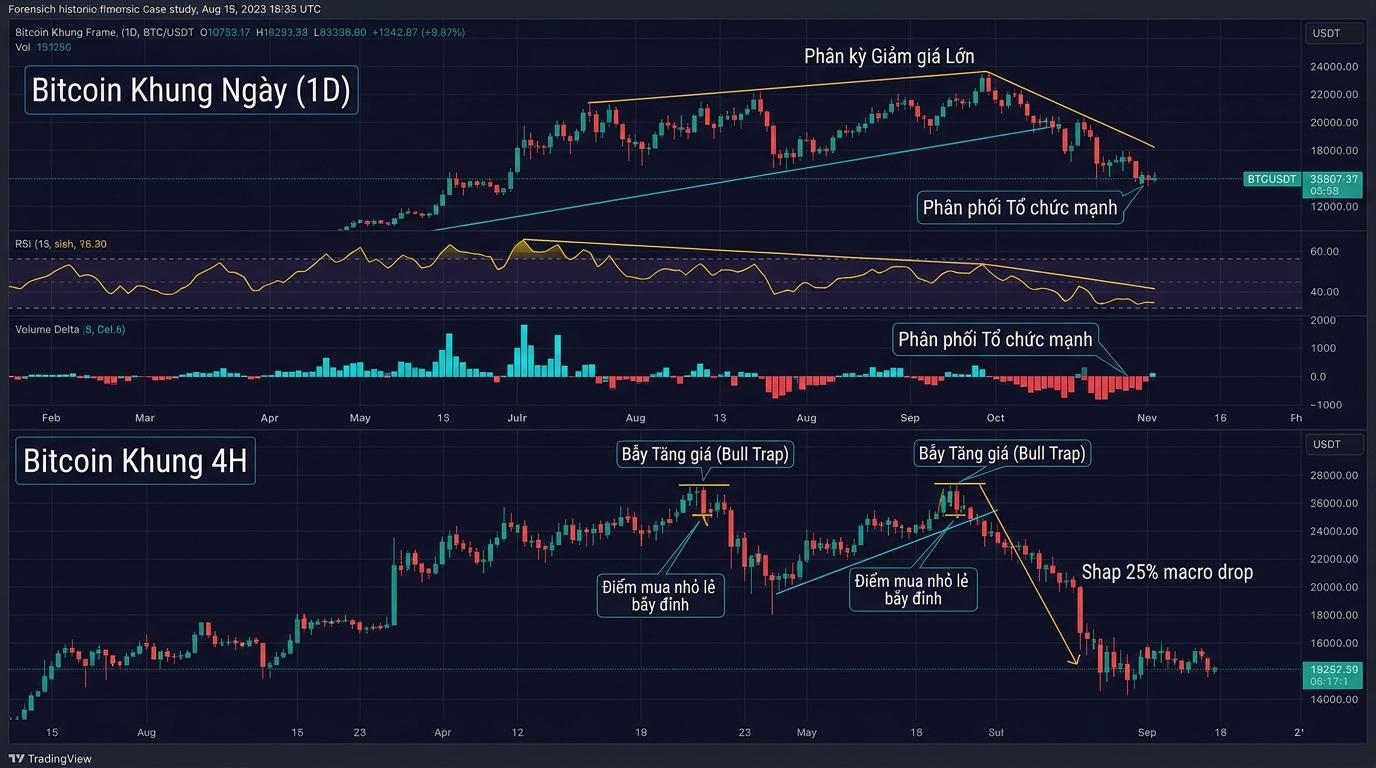
Figure 9: Forensic case study of Daily macro bearish divergence accompanied by deceptive 4H bull traps on Bitcoin.
During historical cycle tops, Bitcoin printed massive Bearish Divergences on the Daily chart as RSI forged lower highs while spot prices pushed higher. Simultaneously, on-chain metrics recorded massive whale inflows into derivatives exchanges.
Yet on 4H charts, recurring breakout rallies enticed aggressive retail participation. Traders who chased these 4H pumps were caught in sudden 25%+ market liquidations, wiping out billions in leveraged open interest within 48 hours.
Conversely, during major macro bottoms, Daily charts developed strong Bullish Divergences as RSI forged higher lows during retests. Synchronized with 4H Double Bottoms and surging volume, traders recognizing multi-timeframe alignment captured extraordinary asymmetric upside.
10. FREQUENCY TRADING & GEM SCANNER: ALIGNING WITH INSTITUTIONAL MOMENTUM
Manually monitoring hundreds of assets across multiple timeframes around the clock is biologically unsustainable. Algorithmic intelligence provides the essential automation to eliminate emotional trading errors.
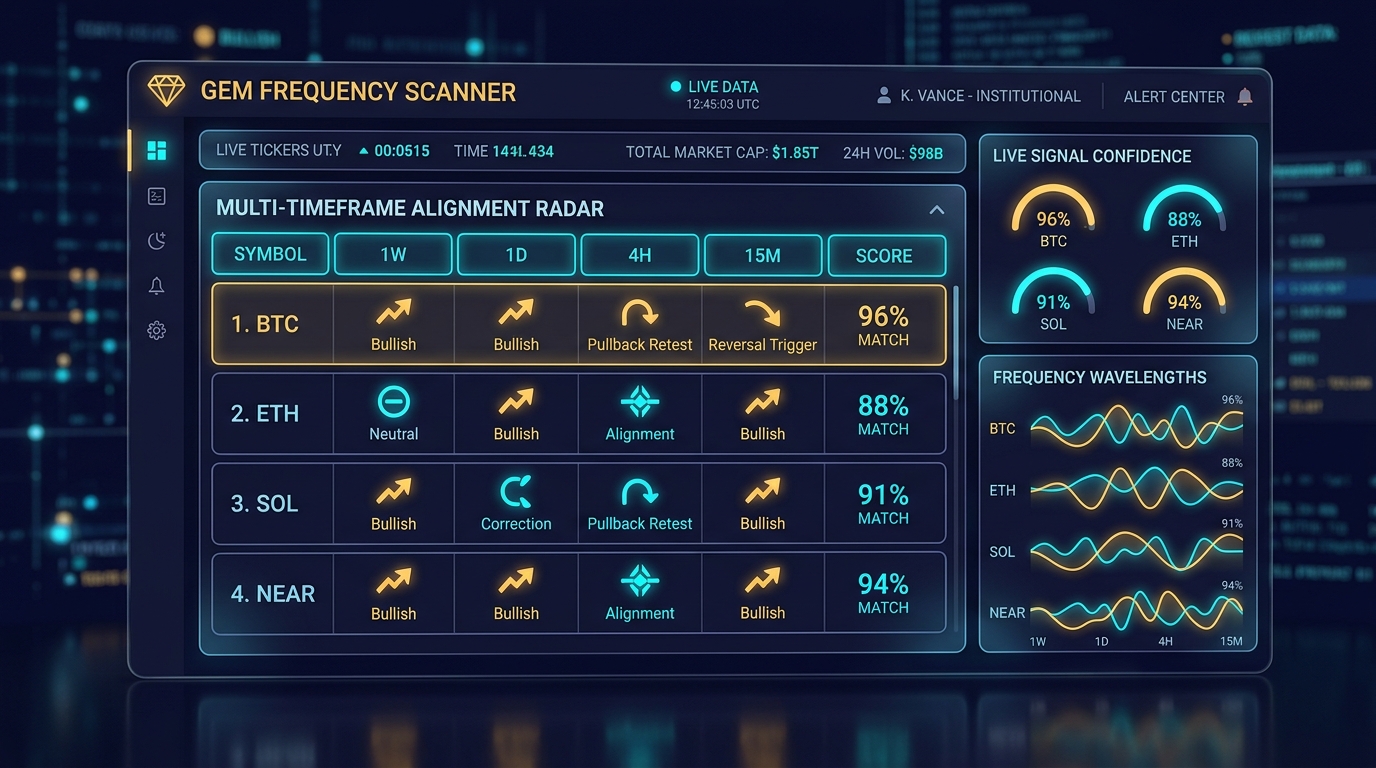
Figure 10: Real-time Multi-Timeframe Alignment Radar on the GEM Frequency Scanner interface.
The GEM Frequency Scanner continuously processes real-time price feeds across 1W, 1D, 4H, and 15M timeframes for over 200 crypto assets. Alerts trigger exclusively when mathematical multi-timeframe resonance occurs between Daily macro bias and lower timeframe liquidity sweeps.
Traders can focus exclusively on pristine, high-probability execution windows without enduring hours of exhausting screen fatigue.
Synthesizing quantitative multi-timeframe telemetry with disciplined risk protocols provides the definitive foundation for long-term capital preservation and market mastery.
REFERENCES & ON-CHAIN DATA SOURCES
- 1. Mandelbrot, B. (1997). Fractals and Scaling in Finance: Discontinuity, Concentration, Risk. Springer New York.
- 2. Wyckoff, R. D. (1931). The Richard D. Wyckoff Method of Trading and Investing in Stocks. Section One to Eight.
- 3. Greene, R. (1998). The 48 Laws of Power. Viking Press.
- 4. Murphy, J. J. (1999). Technical Analysis of the Financial Markets. New York Institute of Finance.
- 5. Glassnode Insights (2025-2026). Bitcoin Derivatives Market & Liquidation Dynamics Reports.
- 6. Coinglass Research (2026). Real-Time Liquidation Heatmap Methodology & Open Interest Analysis.
- 7. CryptoQuant Intelligence (2026). Exchange Inflow/Outflow Metrics and Whale Cluster Tracking.
- 8. Kyle, A. S. (1985). Continuous Auctions and Informed Trader. Econometrica, 53(6), 1315-1335.
- 9. Hasbrouck, J. (2007). Empirical Market Microstructure: The Institutions, Odds, and Prices. Oxford University Press.
- 10. Natenberg, S. (2014). Option Volatility and Pricing: Advanced Strategies and Techniques. McGraw-Hill.
- 11. Tharp, V. K. (2006). Definitive Guide to Position Sizing: How to Evaluate Your System and Use Position Sizing to Meet Your Objectives.
- 12. Kahneman, D., & Tversky, A. (1979). Prospect Theory: An Analysis of Decision under Risk. Econometrica.
- 13. Aldridge, I. (2013). High-Frequency Trading: A Practical Guide to Algorithmic Strategies and Systems. Wiley.
- 14. Harris, L. (2003). Markets and Exchanges: Market Microstructure for Practitioners. Oxford University Press.
- 15. Taleb, N. N. (2007). The Black Swan: The Impact of the Highly Improbable. Random House.
- 16. Douglas, M. (2000). The Disciplined Trader: Developing Winning Attitudes. Prentice Hall Press.
- 17. GEM Quantitative Lab (2026). Multi-Timeframe Frequency Alignment Backtest Engine (n=1,420 trades).
- 18. Kaiko Research (2026). Cryptocurrency Liquidity Depth & Market Fragmentation Across Global CEXs.
- 19. Binance Research (2025). Understanding Tokenomics: Float, Fully Diluted Valuation, and Vesting Hazards.
- 20. DefiLlama Quantitative Metrics (2026). On-Chain DEX Liquidity Pools and Slippage Modeling.
Elevate Trading Mastery & Master Financial Frequency
Select your path to deploy institutional-grade quantitative tools and master professional risk protocols with Gemral.
 AI Tool
GEM Frequency Scanner
Real-time automated multi-timeframe scanner. Detects liquidity convergence and high-probability patterns, eliminating emotional trading.

GEM Trading Starter
Comprehensive foundational course mastering multi-timeframe structure, Risk:Reward position sizing, and essential trading discipline.

7 Days Original Frequency Awakening
7-day subconscious mindset mastery course clearing energetic blocks, realigning financial frequency, and cultivating unwavering trading discipline.