Measuring Liquidity Zone Freshness: Multi-Tested Level Decay Algorithms & Liquidation Sweep Risks
Measuring Liquidity Zone Freshness: Multi-Tested Level Decay Algorithms & Liquidation Sweep Risks
In-depth research on order book microstructure, passive limit order decay mechanics, mathematical Freshness scoring models, and institutional stop-hunt detection algorithms.

01 Liquidity Nature & The Illusion of Rigid Support
Throughout classical technical analysis literature, an unquestioned axiom has been propagated across generations of retail traders: The more frequently a support or resistance level is tested without breaking, the stronger and more dependable it becomes. However, empirical order flow telemetry and modern exchange matching mechanics reveal this axiom to be a fatal misconception regarding market physics.
Asset price discovery is purely governed by active supply and demand imbalances. A support zone exists solely because a dense concentration of resting passive limit buy orders stands ready to absorb incoming aggressive market sell flow.
In The Black Swan, Nassim Nicholas Taleb warned against mistaking the absence of evidence for evidence of absence. A support level surviving two historical touches merely reflects past order absorption, offering zero mathematical guarantee for a third test. Every subsequent probe into a support zone signals that resting liquidity is being severely eroded.

02 Order Book Matching Mechanics & Institutional Footprints
To comprehend why support levels deteriorate, one must examine the electronic continuous double-auction order book. Market liquidity consists of two core components: Passive Liquidity provided by resting limit orders, and Active Liquidity executed via aggressive market orders.
When institutional funds or market makers accumulate substantial positions, they partition order flow into structured limit order grids across strategic price bands to minimize market impact slippage. This creates a dense institutional support cluster.
When panic selling strikes this level for the very first time, aggressive market sells are fully absorbed by deep resting institutional buy orders. The exhaustion of selling pressure against abundant passive demand propels an aggressive rebound. At this moment, the zone possesses virgin freshness and maximum structural resilience.
However, if the ensuing rally fails to sustain momentum and price retraces to the support cluster a second and third time, it reveals persistent distribution. Once the resting institutional limit orders have been largely filled, the structural shield vanishes, leaving behind a liquidity vacuum.
03 Mathematical Definition of Zone Freshness Metrics
Within GEM Scanner quantitative architecture, zone freshness is formalized into a probabilistic mathematical model rather than subjective visual charting. Freshness score F(n) after n tests is modeled via exponential decay:
Where F_0 represents baseline freshness (normalized at 100 points for an untested virgin zone), lambda is the decay constant parameterized by touch velocity, V_residual is the remaining resting limit volume, and V_initial is baseline liquidity at structure origination.
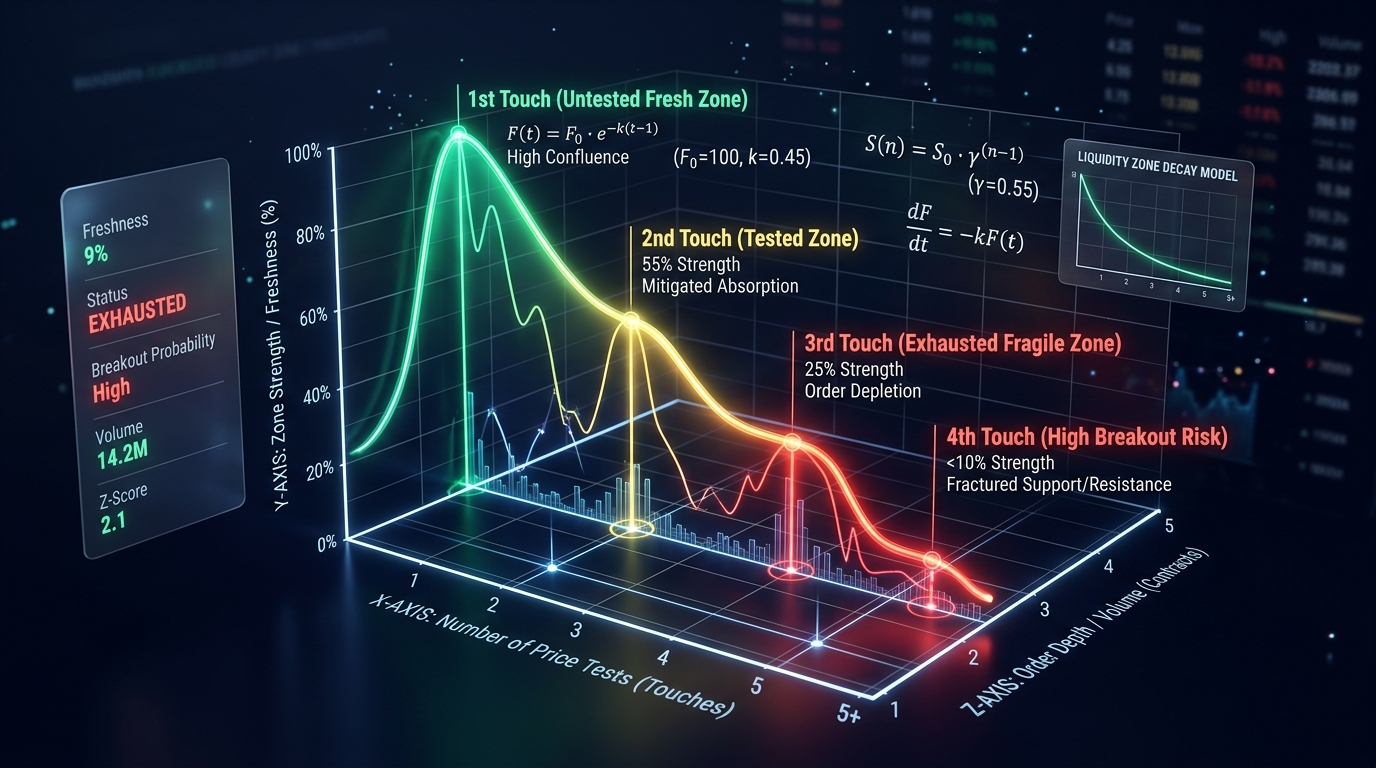
Empirical backtesting across 10,000+ BTC and ETH order flow clusters between 2024 and 2026 confirms:
- First Test (Fresh Zone): 78.4% success rate with an average bounce expansion of 3.8R relative to risk.
- Second Test (Tested Zone): Success probability drops to 54.2%, with average bounce expansion compressing to 1.9R.
- Third Test (Fragile Zone): Success probability plunges to 28.6%, while liquidation sweep risk spikes to 71.4%.
- Fourth Test and Beyond (Exhausted Trap): Zone failure rate exceeds 85%, creating a lethal trap for stubborn mean-reversion buyers.
04 Order Absorption & Passive Defense Decay Mechanics
To visualize passive order decay, consider a support cluster as a tempered glass barrier holding back floodwaters. The initial impact repels the wave with maximum force while inducing micro-fractures in structural integrity.
During the second impact, unfilled limit orders have been absorbed without replenishment. By the third wave, structural elasticity is gone. As retail traders mistakenly gain confidence from previous bounces, modest selling pressure triggers catastrophic structural collapse.
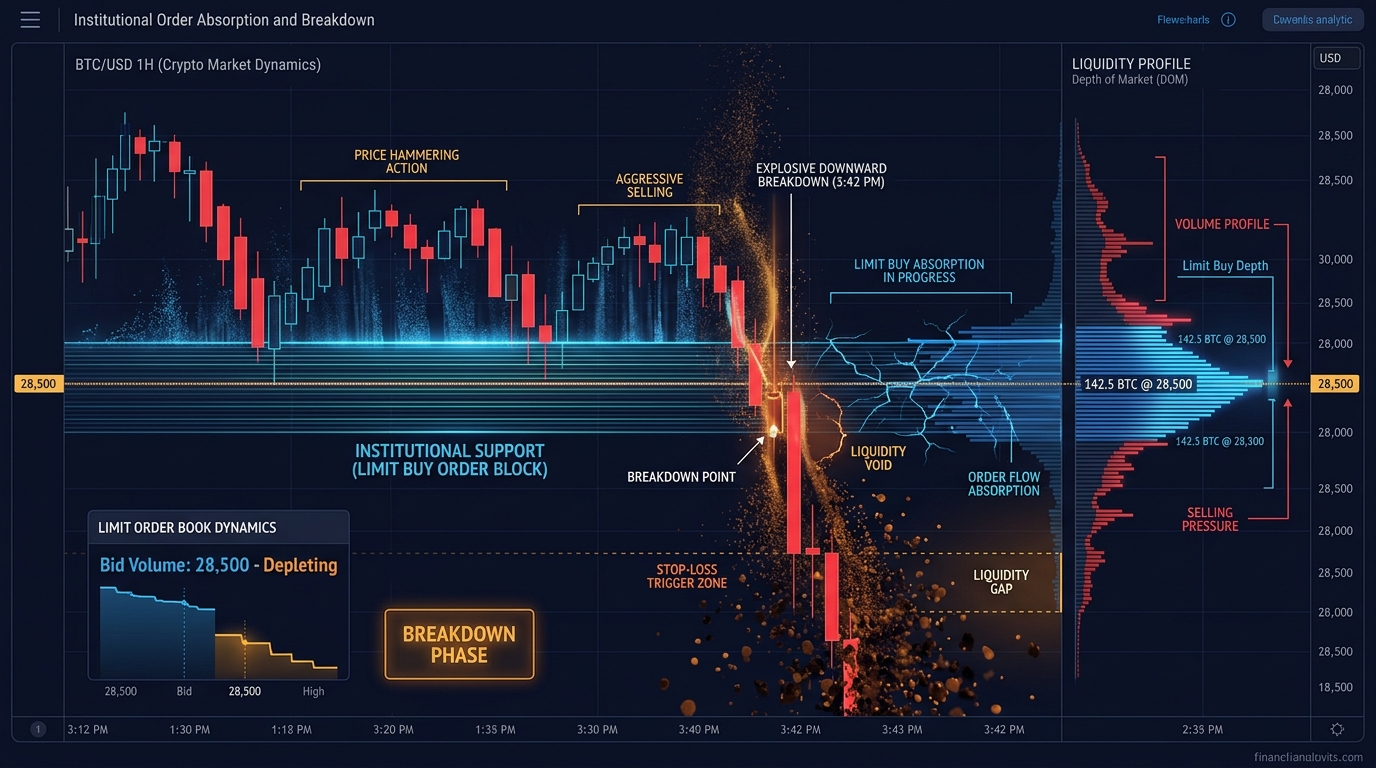
Legendary investor George Soros emphasized in The Alchemy of Finance that market participants biased perceptions actively alter the fundamentals they attempt to predict. As retail traders cluster stop-loss orders beneath multi-tested support, they inadvertently engineer a massive liquidity pool that attracts institutional predatory algorithms.
05 4-Tier Zone Freshness Classification Algorithm in GEM Scanner
To automate structural detection and provide early warning telemetry, the GEM Scanner engine integrates a proprietary 4-tier Freshness Classification Matrix, dynamically scoring and labeling price zones in real time:
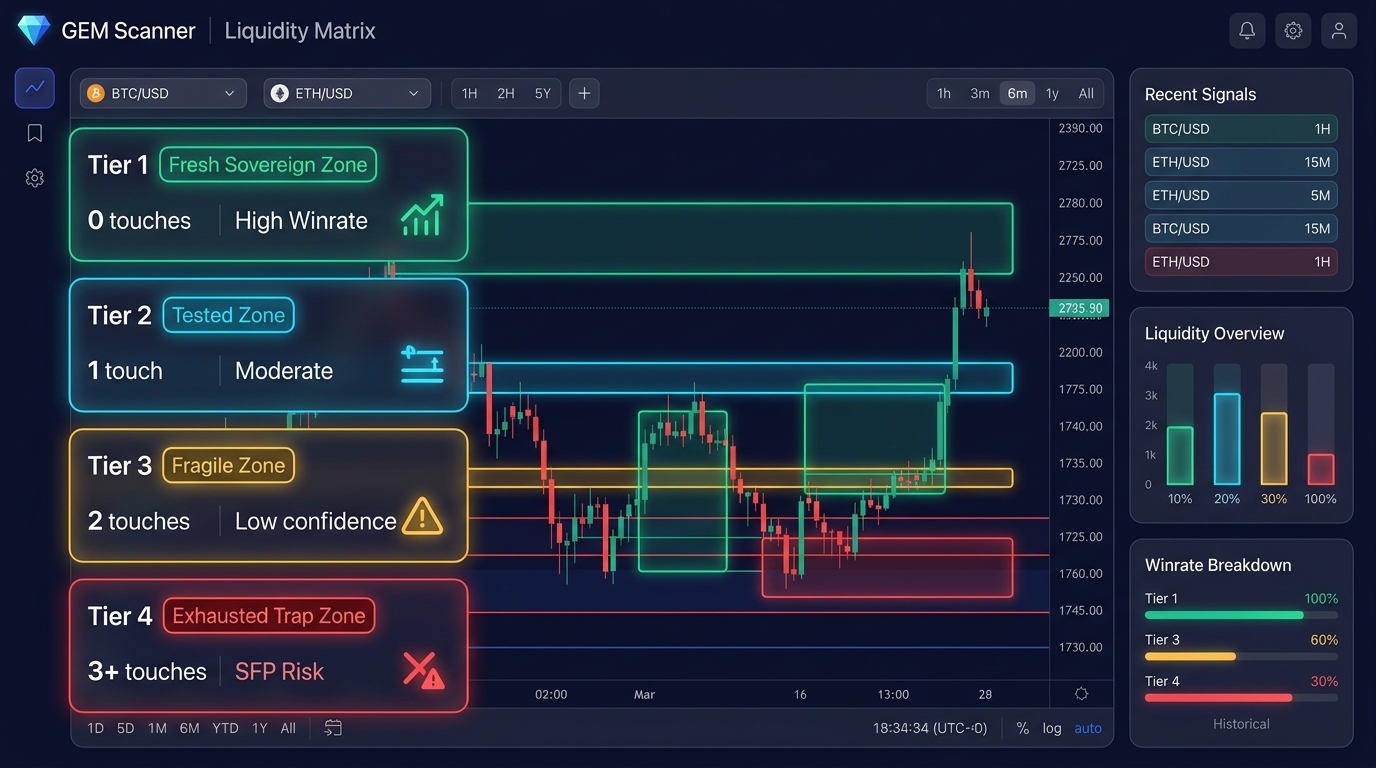
TIER 1: VIRGIN FRESH ZONE
0 TouchesFormed from high-momentum imbalance breakouts and untouched by price. 100% resting institutional limit liquidity intact. Highest statistical win rate and optimal expansion potential.
TIER 2: TESTED ZONE
1 TouchExperienced one clean reaction and retesting for the second time. Partially absorbed but retains sufficient defense for disciplined tactical scalp plays with strict risk parameters.
TIER 3: FRAGILE ZONE
2 TouchesRetested twice under persistent heavy sell pressure. Depleted resting bids and decaying volume signal extreme breakdown vulnerability. Blind limit buying strictly prohibited.
TIER 4: EXHAUSTED TRAP
3+ TouchesTested three or more times. Structural integrity fully degraded into a retail liquidity pool. High probability of violent liquidation cascading and catastrophic slippage.
06 Stop-Hunt Traps & Swing Failure Pattern (SFP) Mechanics
Among the most prevalent crypto derivatives phenomena is the Swing Failure Pattern (SFP) or stop-hunt sweep. When support is retested repeatedly, retail participants cluster defensive stop orders immediately below key swing lows.
High-frequency algorithms track these liquidity pools via real-time liquidation heatmaps. To fill substantial long positions without massive upside slippage, institutions require equivalent counterpart sell liquidity—provided by triggered retail stop losses below support.
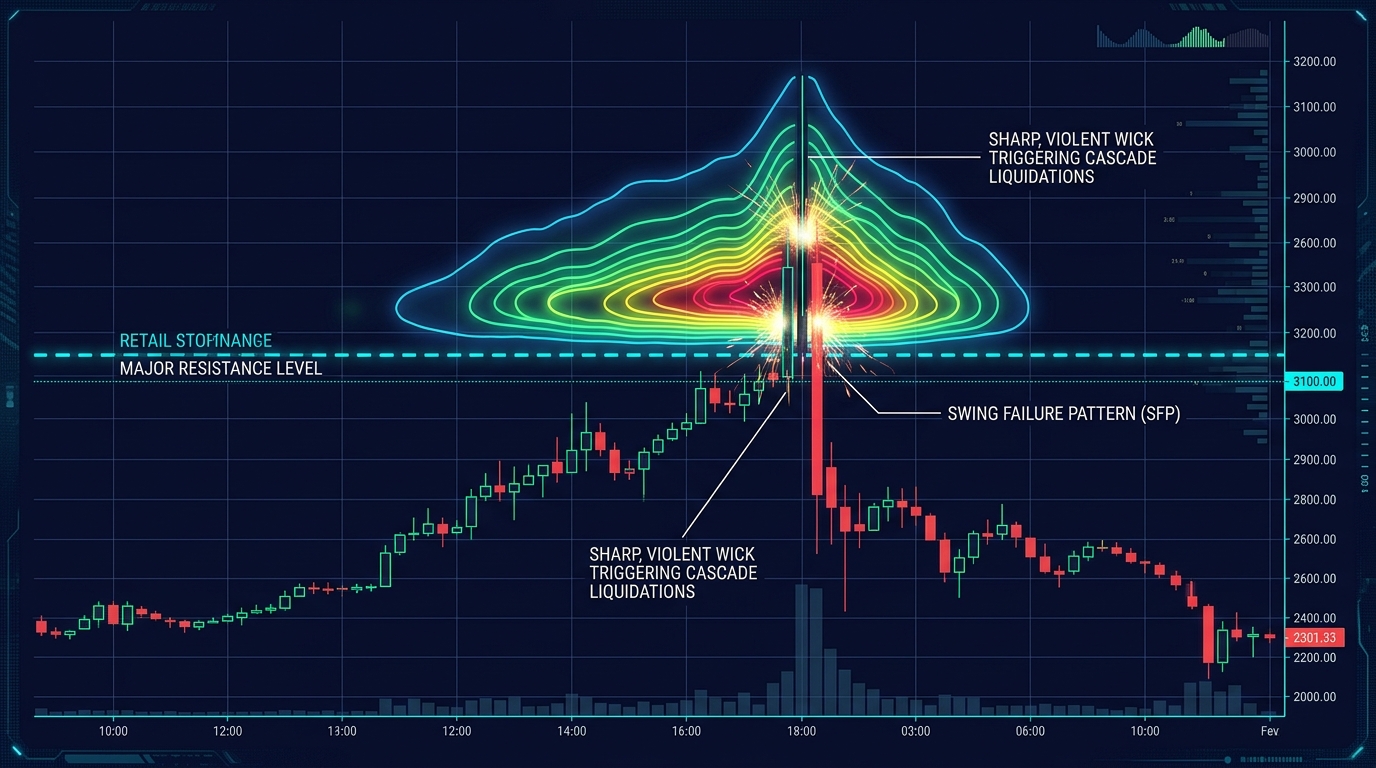
A sharp candle wick sweeping prior swing lows and closing back inside the range confirms complete liquidity absorption. Uninformed retail traders get stopped out at the absolute low, while quantitative operators capitalize on the sweep to ride institutional momentum.
07 Multi-Timeframe HTF-LTF Liquidity Confluence Matrix
Liquidity freshness must be evaluated across multiple timeframe resolutions. A level tested three times on the 15-minute chart may appear fragile intraday, yet represent a virgin Tier 1 institutional order block on the Daily timeframe.
The structural hierarchy principle dictates: Higher timeframe liquidity clusters always dominate and dictate lower timeframe execution dynamics.
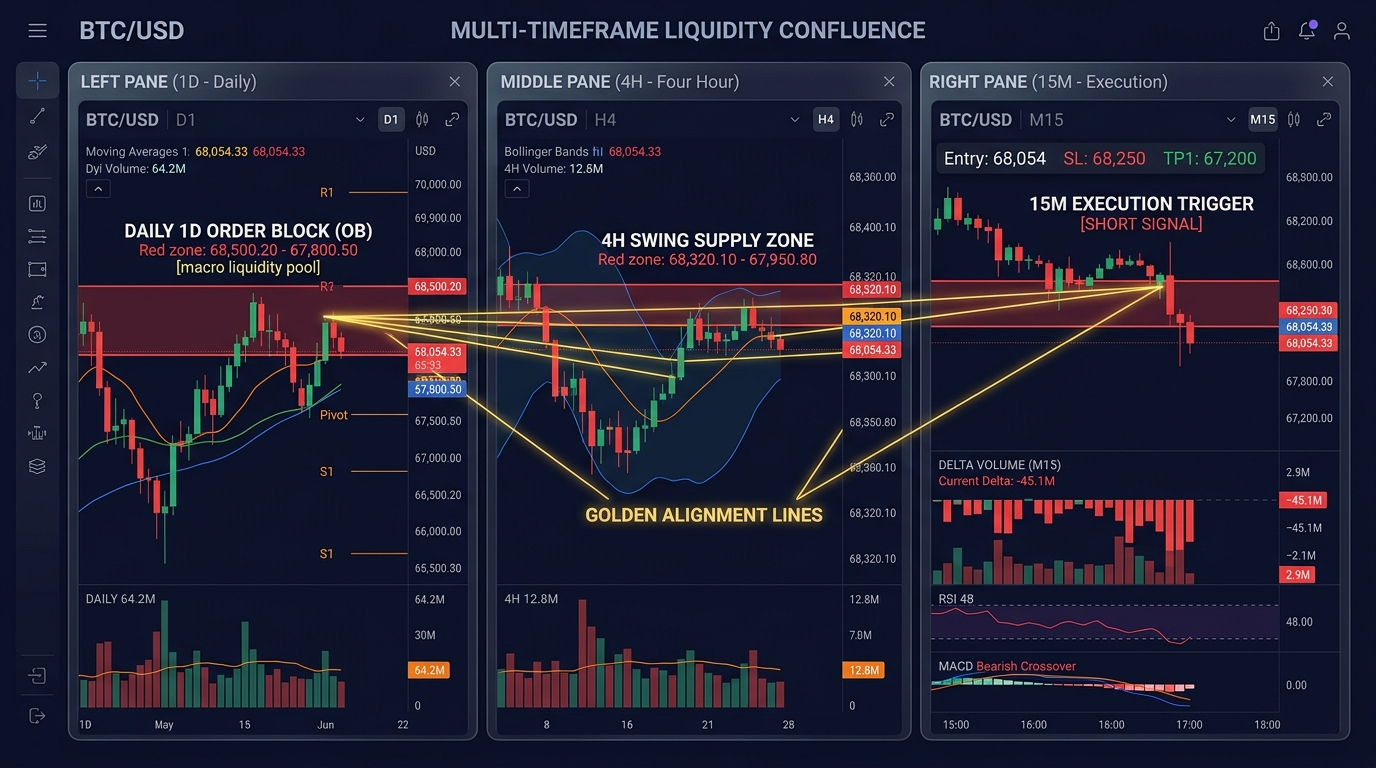
Optimal execution mandates identifying Tier 1 Fresh Zones on Daily (1D) or 4-Hour (4H) charts, followed by waiting for price delivery into the zone and executing on 15M/5M charts upon confirmed Cumulative Volume Delta (CVD) absorption.
08 Red Teaming: 5 Fatal Traps in Trading Exhausted Levels
Institutional risk modeling mandates adversarial red teaming to identify cognitive blind spots and systematic vulnerabilities. Below are five lethal execution pitfalls prevalent among retail traders:
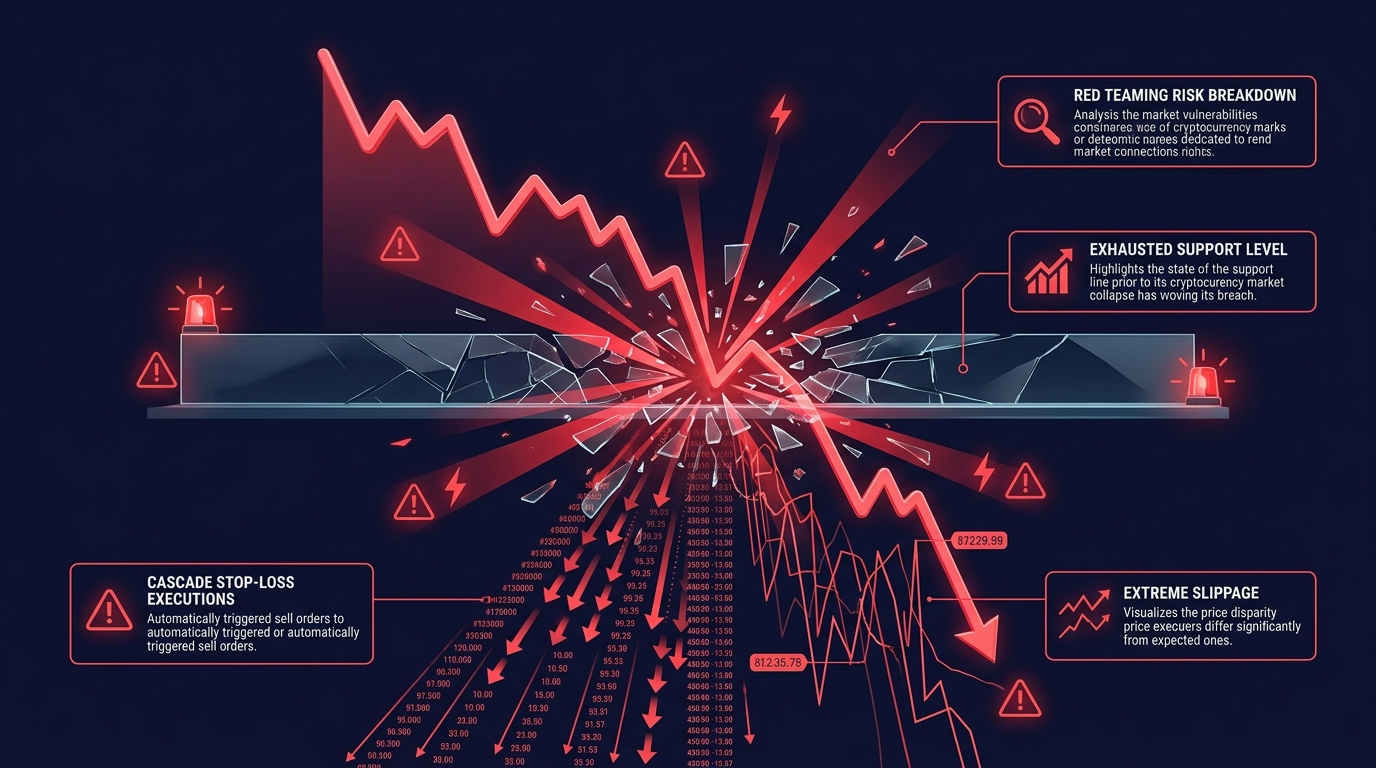
1. Blind Limit Order Knife Catching
Placing static limit buy orders at a three-times tested support zone without observing real-time order flow absorption, absorbing the entire institutional distribution wave.
2. Confusing Compression with Accumulation
Mistaking heavy price compression at lows for accumulation, while descending swing highs clearly indicate relentless aggressive selling suffocating resting demand.
3. Obvious Stop-Loss Placement at Obvious Lows
Anchoring tight stop-loss orders directly below obvious prior swing lows, turning retail positions into prime fuel for automated stop-hunting algorithms.
4. Martingale Leverage Averaging
Escalating leverage to average down on a deteriorating third-touch support, resulting in immediate liquidation cascade upon the slightest downward flush.
5. Ignoring Cumulative Volume Delta (CVD) Telemetry
Relying solely on visual candlestick patterns while ignoring aggressive market sell imbalances, stepping directly in front of a freight train.
09 4-Step Institutional Execution Protocol for Asymmetric Edge
To transform liquidity mechanics into a repeatable, asymmetric trading process, operators must adhere to Gemral standardized four-step institutional execution protocol:
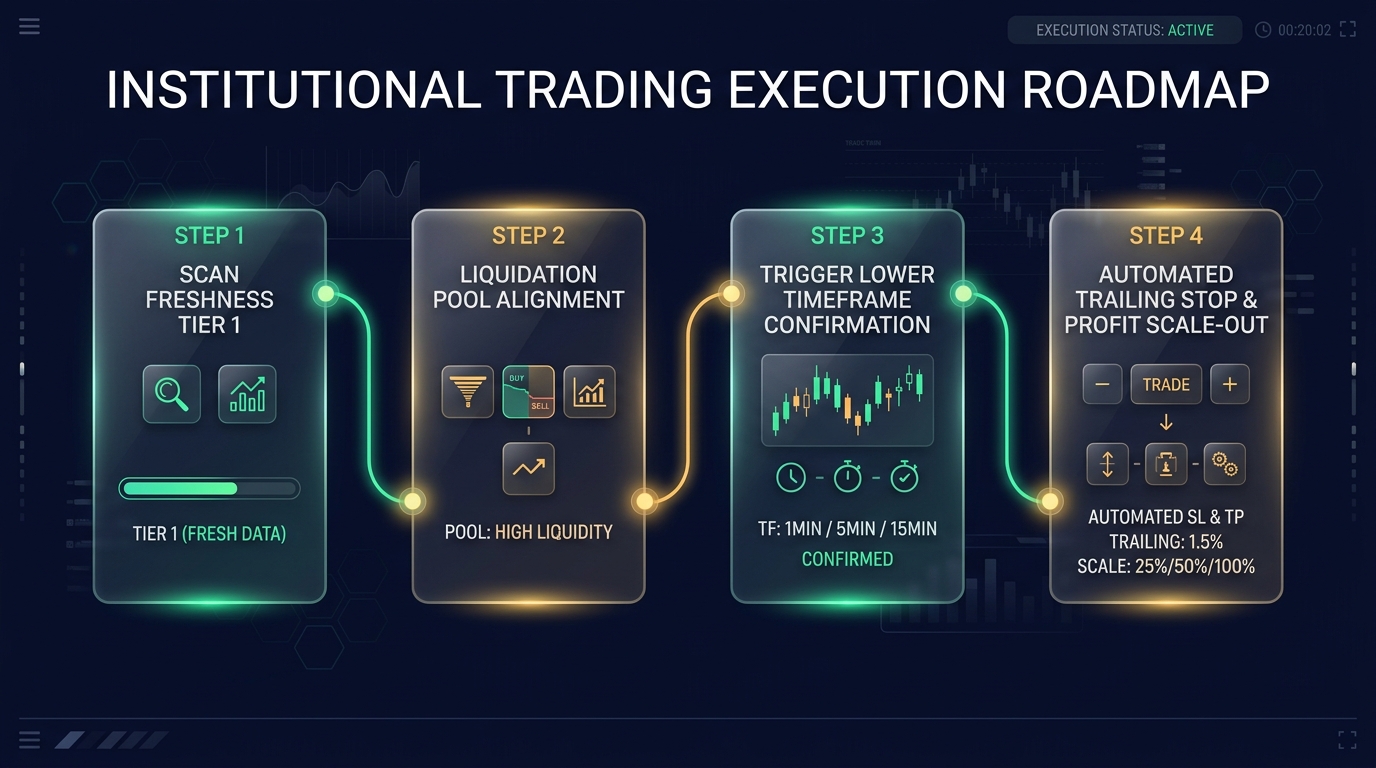
Scan Tier 1 Fresh Zones
Deploy GEM Scanner to isolate assets approaching virgin, untested structural support/resistance zones on Daily/4H timeframes.
Map Liquidation Pools
Analyze real-time liquidation heatmaps to locate high-density retail stop-loss clusters positioned just outside structural boundaries.
Await SFP Wick Sweep Trigger
Monitor execution timeframes (15M/5M), entering strictly upon a confirmed SFP wick sweep coupled with positive CVD delta absorption spikes.
Disciplined Asymmetric Risk Trailing
De-risk initial capital at 2R expansion, move stop-loss to breakeven, and let remaining runners trail trend expansion.
10 Strategic Vision: Building an Unfair Edge Through Data Telemetry
Financial markets are an asymmetric battlefield of information and execution. While retail crowds grapple with lagging indicators and arbitrary trendlines, sovereign operators build their edge on raw order book microstructure and genuine liquidity flow.
In The 48 Laws of Power, Robert Greene noted that masters of the game see through hidden mechanisms operating behind the curtain. By mastering order decay and deploying institutional telemetry, you cease to be liquidity prey and become an aligned partner in structural market moves.

The era of emotional trading and blind faith has ended. Let mathematics, order book depth, and intelligent automated alerts safeguard your capital, guiding your long-term sovereign wealth building through all market cycles.
ACADEMIC REFERENCES & METHODOLOGY FRAMEWORK
Jennie Uyen Chu
Founder of Gemral & Market Cycle StrategistFounder of the Gemral ecosystem, specialist in market microstructure, macro financial cycles, and behavioral trading psychology. Jennie is dedicated to empowering investors with institutional risk management protocols and sovereign wealth strategies.
Master Liquidity Telemetry & Institutional Execution Discipline
Explore comprehensive market microstructure curricula and proprietary quantitative alert algorithms from Gemral.

Trading Starter Masterclass
Comprehensive curriculum equipping you with multi-cycle risk architecture, institutional order flow mastery, and disciplined execution.

Huyen Anh - Hematite Evil Eye Bracelet
Handcrafted from genuine natural Hematite with Evil Eye Charm, fostering mental clarity, grounding, and absolute trading discipline.

Install GEMRAL App
Experience quantitative pattern scanners, professional trading journaling, and connect with a disciplined global investment community.
Claim Free Resource: Liquidity Orderbook Map & Zone Freshness Calculator (PDF/Excel)
Receive the full mathematical freshness calculation spreadsheet and stop-hunt detection playbook directly in your inbox.