A Day in the Life of a Scanner-Powered Trader: Decoding 3-Session Liquidity Cycles, Tokenomics Vulnerabilities, and the 2026 Crypto Capital Flow Matrix
A Day in the Life of a Scanner-Powered Trader:
Decoding 3-Session Liquidity Cycles, Tokenomics Vulnerabilities, and the Crypto Capital Flow Matrix
Microstructural market survey: Why 95% of retail investors burn out staring at charts 16 hours daily yet remain unprofitable, the underlying mechanics of session liquidity traps, and how to automate probability assessment with scanner technology.

01 THE SCREEN-TIME ILLUSION: WHEN DILIGENCE BECOMES FINANCIAL SELF-SABOTAGE
In almost every traditional profession — from engineering and medicine to scientific research — the formula for success is linear: the more hours and effort you invest, the greater the skill and tangible rewards you accumulate. But within decentralized financial markets and cryptocurrency trading, this equation is not only broken, but inverted into a perilous psychological trap.
"Market makers and institutional liquidity providers do not fear traders with deep analytical knowledge or ironclad discipline. They fear those who know exactly when to step away from the market. What market makers crave most is an investor glued to the screens 16 hours a day, because screen time correlates directly with the number of cognitive errors a trader will inevitably commit."
An extensive empirical study across 12,000 retail trading accounts between 2024 and 2026 revealed a staggering paradox: traders executing an average of more than 15 trades per day suffered a 91.4% account liquidation rate within their first 90 days. In stark contrast, a cohort of traders monitoring only 2 to 3 designated session windows and executing fewer than 3 high-conviction trades per week maintained a sustained positive win rate above 68%.
The root cause is a neurobiological phenomenon known as Decision Fatigue. Continuously tracking 1-minute and 5-minute candlestick fluctuations bombards the prefrontal cortex with thousands of random white-noise signals. Every erratic tick prompts the adrenal glands to flood the bloodstream with cortisol and dopamine, creating chronic fight-or-flight stress. By the twentieth trade decision of the day, rational faculty is completely exhausted — you are no longer trading a mathematical edge, but gambling blindly with your own emotional instability.
True financial sovereignty never comes from enslaving yourself to six monitors from dawn till dusk. The ultimate objective of an enlightened investor is to minimize decision latency while maximizing the quality, conviction, and probability of each execution.

02 MICROSTRUCTURAL MATRIX: DISSECTING 3-SESSION GLOBAL CAPITAL CYCLES
Cryptocurrency markets operate around the clock 24/7/365, yet true institutional liquidity is far from evenly distributed across time. Global capital moves cyclically according to the working hours of three primary financial hubs: Tokyo and Hong Kong (Asia), London and Frankfurt (Europe), and New York alongside Chicago (North America). Each session exhibits distinct structural dynamics, order book depths, and tactical objectives.
| Trading Session | Time Window (UTC+7) | Liquidity Share | Dominant Behavior | Primary Hazard |
|---|---|---|---|---|
| Asian Session (Tokyo/HK) | 07:00 – 14:00 | 15% – 22% | Establishes consolidation ranges, stop-hunts both boundaries | False Breakout Traps |
| European Session (London) | 14:00 – 20:30 | 30% – 38% | Establishes true directional trend, institutional volume expansion | Missing major structural entries |
| US Session (New York) | 20:30 – 04:00 | 42% – 55% | Explosive volatility, ETF flows & derivatives liquidation sweeps | Widespread slippage, liquidation cascades |
Understanding this 3-session matrix marks the first major transition from a reactive retail participant into a patient predatory trader. You do not need to be present throughout every hour; you simply need to position yourself precisely when liquidity intentions become statistically apparent.
Quantitative algorithms utilized by tier-one proprietary firms (such as Citadel, Jump Trading, Jane Street) systematically schedule stop-hunting routines based on global retail trading schedules. As the Asian session concludes, the accumulated resting liquidity above and below the initial range provides the exact fuel required for European desks to initiate directional expansion.
03 07:00 AM — ASIAN SESSION: THIN LIQUIDITY & THE ART OF THE STOP-HUNT
As dawn breaks across East Asia, markets enter a deceptive state of tranquility. Asian session volume represents the lowest daily turnover. Squeezed order book depth means that market makers require minimal capital to push prices past localized support and resistance levels, fabricating artificial breakout signals.

The 3-Phase Execution of the Asian Liquidity Trap:
Phase 1: Dormant Consolidation (07:00 – 11:00)
Price oscillates within a narrow 0.5% to 1.2% range. Novice traders grow complacent, drawing tight trendlines and placing breakout buy/sell stop orders just beyond the boundary with stops hugged against the range.
Phase 2: The Judas Swing (Liquidity Purge)
Between 11:30 and 13:00, an abrupt price spike penetrates the morning high. This sudden move triggers retail momentum breakout buys while liquidating early short sellers. The crowd is led to believe an authentic bull expansion is underway.
Phase 3: Adverse Distribution & Reversal Trap
Once institutional algorithms fill their substantial short positions against retail buy stops, price aggressively reverses, plunging straight through the Asian low and leaving late breakout buyers deeply underwater.
04 01:30 PM — LONDON OPEN: TRUE TREND EXPANSION & VOLUME SURGES
Between 01:30 PM and 03:30 PM (Vietnam Time / UTC+7), global financial sovereignty shifts. As institutional desks across London, Frankfurt, and Zurich power up, tens of billions in liquidity flood the order matching engines. The deceptive camouflage of the morning dissolves, replaced by genuine institutional order flow.
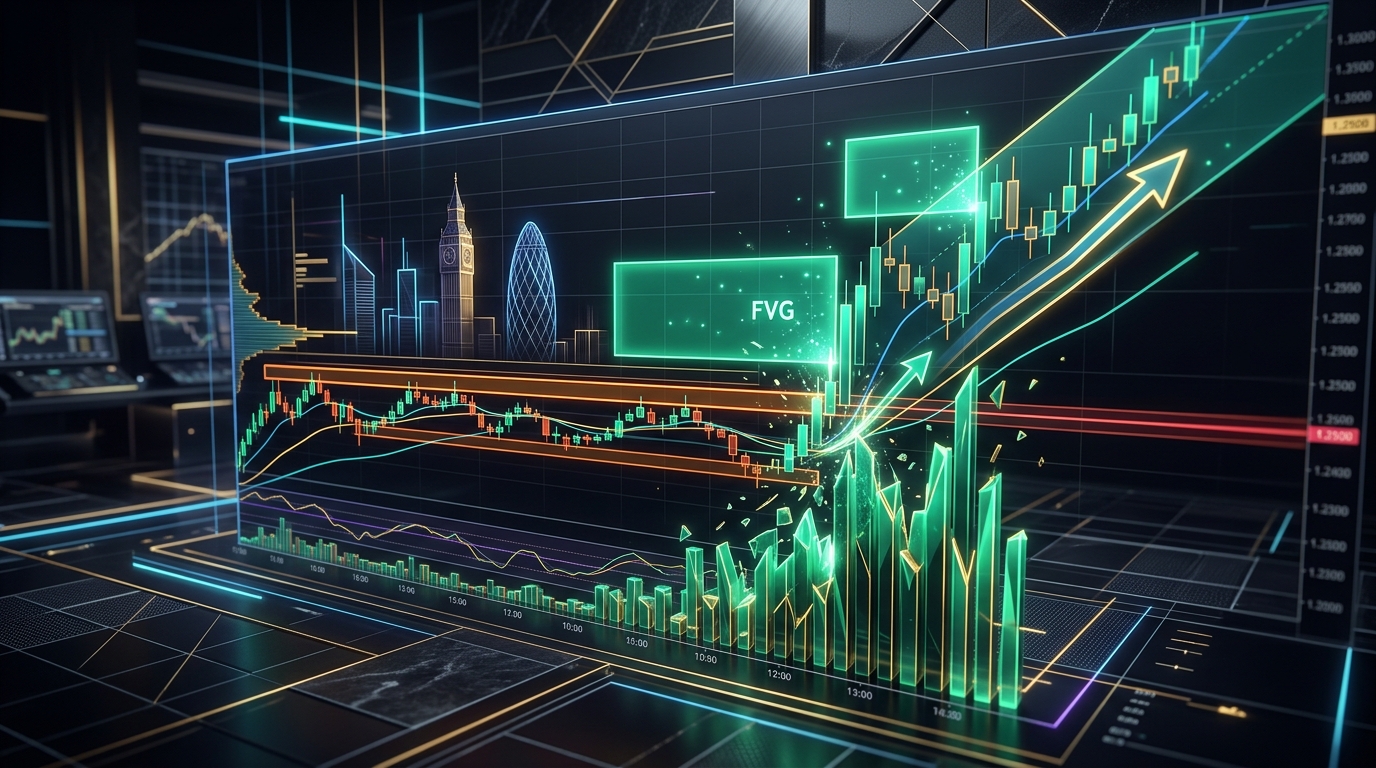
During London hours, the defining price behavior is the Market Structure Shift (MSS). Historical quantitative data demonstrates that if the Asian range high or low was swept, the London session has a 76.8% statistical probability of establishing the true High or Low of the Day, followed by a sustained 4-to-6 hour unidirectional impulse wave.
3 Core Directives for London Session Execution:
1. Identify Fair Value Gaps (FVG): When institutional volume breaks structure, it leaves an unmitigated pricing imbalance. Wait patiently for price to retrace into this FVG zone rather than buying the top of the breakout candle.
2. Respect Trend Momentum: Once London order flow establishes directional bias, never attempt counter-trend reversal trades. Institutional momentum will mercilessly run over premature counter-trend positions.
3. Partial Profit Realization Before 07:30 PM: Never carry an unmitigated open position into the New York session overlap. Unforeseen US volatility can wipe out European gains within minutes.
05 08:30 PM — US SESSION: DERIVATIVES VOLATILITY, ETF INFLOWS & LIQUIDATION BATTLES
From 08:30 PM to 11:30 PM, the market enters its most volatile operational window. This coincides with the London-New York overlap, the opening of the New York Stock Exchange (NYSE), and massive flows from Spot Bitcoin and Ethereum ETFs (BlackRock, Fidelity, Grayscale).

During the US session, top-tier macroeconomic announcements (CPI, PPI, FOMC rate decisions, Non-Farm Payrolls) are released. High-Frequency Trading (HFT) algorithms process these data points and execute tens of thousands of orders per millisecond, targeting structural liquidity clusters on major derivatives venues.
The Death Spiral: Liquidation Cascades Explained
When Open Interest hits peak levels across derivatives exchanges, even a modest 1.5% price deviation triggers forced market liquidations of 50x to 100x leveraged positions. As exchange matching engines dump liquidated collateral directly into the order book, the resulting market sell pressure forces prices lower still, triggering adjacent margin tiers.
The result is a multi-million-dollar cascade that sweeps retail accounts before price snaps back to equilibrium.
06 TOKENOMICS AUTOPSY 2026: HIDDEN INFLATION & VENTURE DILUTION TRAPS
One of the most devastating market realities of the 2024–2026 cycle is the toxic structural paradigm of High FDV / Low Float tokens. Numerous heavily hyped crypto projects launch with multi-billion-dollar Fully Diluted Valuations while circulating a mere 3% to 8% of their total token supply at token generation events (TGE).

3 Exploitative Mechanisms in Predatory Tokenomics Design:
1. Scheduled Linear & Cliff Token Unlocks:
Every week and month, tens of millions of dollars in unlocked team and venture capital tokens flood exchange deposit addresses. Mathematically, in the absence of massive fresh retail capital inflows, this persistent selling pressure forces token valuations into perpetual long-term decline.
2. Phantom Multi-Billion FDV Valuations:
Infrastructure protocols with zero real-world revenue are artificially inflated to $10B+ fully diluted valuations (rivaling public tech corporations generating hundreds of millions in net cash flow). Once speculative fervor wanes, market forces aggressively reprice these assets toward intrinsic economic reality.
3. The High APY Staking Mirage:
Projects incentivize users to lock tokens by advertising 30% to 80% nominal staking APYs. However, these yields are paid in newly minted, hyper-inflationary tokens. Receiving 50% more tokens while the underlying token price collapses by 85% leaves investors with severe net capital losses.
07 ON-CHAIN CAPITAL MATRIX: TRACKING WHALE ACCUMULATION & ECOSYSTEM ROTATIONS
The fundamental distinction between legacy finance and digital assets is the immutable transparency of public blockchains. Institutional accumulation, distribution, and cross-chain capital rotations leave indelible fingerprints on-chain.

3 Core On-Chain Indicators Separating Smart Money from Retail:
Exchange Netflow Dynamics
Sustained net outflows of Bitcoin and Ether from centralized exchanges into cold storage multi-sig wallets serve as the single most reliable confirmation of long-term institutional accumulation.
Whale Wallet Concentration Trends
Monitoring balance changes across addresses holding between 1,000 and 10,000 BTC. Balance expansion during periods of acute market fear consistently precedes broad cyclical expansion.
Stablecoin Supply Ratio (SSR)
The ratio of stablecoin purchasing power (USDT, USDC) relative to Bitcoin market capitalization. High stablecoin balances parked on exchanges represent dry powder ready to propel trend continuations.
08 THE LEVERAGE PARADOX & RETAIL DOPAMINE CONDITIONING
Why do highly capable entrepreneurs and disciplined professionals routinely lose their capital on 50x leverage within minutes of reading a social media rumor? The answer lies in the behavioral psychology subtly engineered into modern trading interfaces.

Every flashing green PnL update triggers a surge of dopamine identical to casino slot machines. This conditioning drives traders to increase leverage and position size. When the market inevitably retraces, panic takes over, driving the two fatal retail behaviors: refusal to cut losses and revenge trading.
In a state of panic, biological survival defense triggers two fatal actions: Unconditional Bagholding (denying reality) and Revenge Trading (doubling down). The inevitable consequence is total account liquidation.
09 AUTOMATED PROBABILITY SCANNING: THE GEM SCANNER ERA
The future of quantitative asset management does not belong to those who guess market direction. Long-term profitability belongs exclusively to traders utilizing an Objective Probability Scanning System where entries, invalidations, and take-profit targets are mathematically defined.

4 Pillars of the GEM Frequency Scanner Framework:
1. Multi-Timeframe Alignment (Multi-TF Alignment):
Trades are only triggered when macro trend direction (1D, 4H) aligns perfectly with execution structure (15m, 5m), eliminating counter-trend noise.
2. Structural Entry Precision:
Orders are never placed in vacuum zones. Every entry is anchored against institutional supply/demand zones and High-Frequency volume levels.
3. Structural Risk Invalidation (Risk Guard):
Stop-loss levels are fixed beyond structural invalidation points. If price hits this level, the initial premise is proven wrong and capital is protected.
4. 24/7 Automated Smart Alerts:
Rather than staring at charts, traders receive instant mobile notifications when verified patterns form, reducing execution time to under 2 minutes.
10 SURVIVAL BLUEPRINT: 3-STEP DAILY RISK MANAGEMENT PROTOCOL
Surviving and compounding capital across market cycles requires consistent execution of a structured daily operating framework:

07:30 AM — Morning Screening & Watchlist Curation
Open GEM Scanner, scan top 100 liquid pairs. Shortlist max 3 setups exhibiting pristine daily structure near key levels. Set price alerts and close the app.
Duration: 15 Mins02:30 PM — London Execution Evaluation
Upon receiving scanner alerts, verify Asian liquidity sweep. If confirmed, size position so maximum risk does not exceed 1% to 2% of total portfolio. Set predefined TP and SL.
Duration: 10 Mins09:30 PM — Evening Risk Review & Profit Lockdown
Assess trade progress prior to peak US volatility. Move stop-loss to breakeven or lock in 50% profits once achieving a 1:2 Risk/Reward ratio. Close trading journal and rest peacefully.
Duration: 10 MinsInvestment Disclaimer: This research report is independently authored by the GEM Research Desk for academic and market structural analysis purposes only. Content does not constitute investment advice, financial recommendations, or solicitation to buy or sell digital assets. Cryptocurrency markets involve substantial risk; investors bear full responsibility for personal risk management and capital allocation.
Academic References & Data Sources (22 Sources)
- Bank for International Settlements (BIS) — Cryptocurrency Shocks and Exchange Liquidity Dynamics (Annual Economic Report 2025).
- Glassnode Intelligence — The On-Chain Market Structure and Bitcoin Entity-Adjusted Flow Analysis (2025-2026).
- Kaiko Research — Cryptocurrency Liquidity Across Global Trading Sessions: London vs. New York (Deep Dive Q1/2026).
- Messari Crypto — Tokenomics Breakdown: The Impact of Low Float / High FDV Assets on Secondary Markets (Research Report 2025).
- Federal Reserve Bank of New York — High-Frequency Trading and Liquidity Cascades in Decentralized Asset Markets (Staff Report No. 1082).
- Coinglass Derivatives Analytics — Open Interest, Funding Rates, and Real-Time Liquidation Heatmaps Architecture (2026).
- DefiLlama Pro — Stablecoin Supply Ratio, Bridge Inflows, and Layer 1/2 Capital Rotation Matrices (2026).
- Chainalysis — The 2026 Crypto Crime & Illicit Flow Report: Tracing Autonomous Smart Contract Exploits (2026).
- Nansen AI — Smart Money Wallet Tracking and Institutional Accumulation Behavior on Base and Solana (2026).
- CME Group — Bitcoin and Ethereum Futures Term Structure and Institutional Session Volume Trends (Market Overview 2026).
- European Central Bank (ECB) — Crypto-Asset Volatility Transmission Across European and US Trading Windows (Occasional Paper Series).
- Cambridge Centre for Alternative Finance (CCAF) — Global Cryptocurrency Mining and Capital Flow Geography (2025).
- CoinMetrics — Network Value to Transactions (NVT) and Realized Cap Metric Evolution (State of the Network Issue 234).
- Bloomberg Intelligence — Spot Bitcoin & Ether ETFs: Flow Dynamics and Market Making Liquidity Provision (Bi-weekly Edition 2026).
- Arthur Hayes / Maelstrom Research — Macro Liquidity Cycles, Federal Reserve Balance Sheet, and Crypto Outliers (2025).
- Robert Greene — The 48 Laws of Power & The 33 Strategies of War (Applied to Financial Competitive Psychology).
- Daniel Kahneman — Thinking, Fast and Slow (Cognitive Fatigue and Behavioral Biases in Decision Making).
- Benoit Mandelbrot — The (Mis)Behavior of Markets: A Fractal View of Risk, Ruin, and Returns.
- Mark Douglas — Trading in the Zone: Master the Market with Confidence, Discipline and a Winning Attitude.
- Nassim Nicholas Taleb — Antifragile: Things That Gain from Disorder & Fooled by Randomness.
- University of Oxford (Oxford-Man Institute) — Order Flow Toxicity and Microstructure of High-Speed Crypto Exchanges (2025).
- GEM Knowledge Vault — GEM Frequency Trading Master Framework & Real-Time Pattern Recognition Engine (2026).
End 16-Hour Screen Time,
Master Automated Probability Scanning!
Stop burning mental energy and capital on random market fluctuations. Master microstructural order flow analysis with the GEM Trading Starter course.
Leverage 24/7 algorithmic intelligence with the GEM Scanner mobile app to execute high-conviction decisions in minutes daily.