Crypto Market & Portfolio Research Report Q3/2026: On-Chain Flow Tracking, Portfolio Drift Alerts & Automated AI Risk Management
CRYPTO MARKET & PORTFOLIO RESEARCH REPORT Q3/2026:
On-Chain Flow Tracking & Automated Risk Management
Decoding institutional capital flow structures, dissecting covert tokenomics dilution mechanics, liquidity trap paradoxes, and establishing a macro-adaptive 4-tier portfolio allocation matrix.
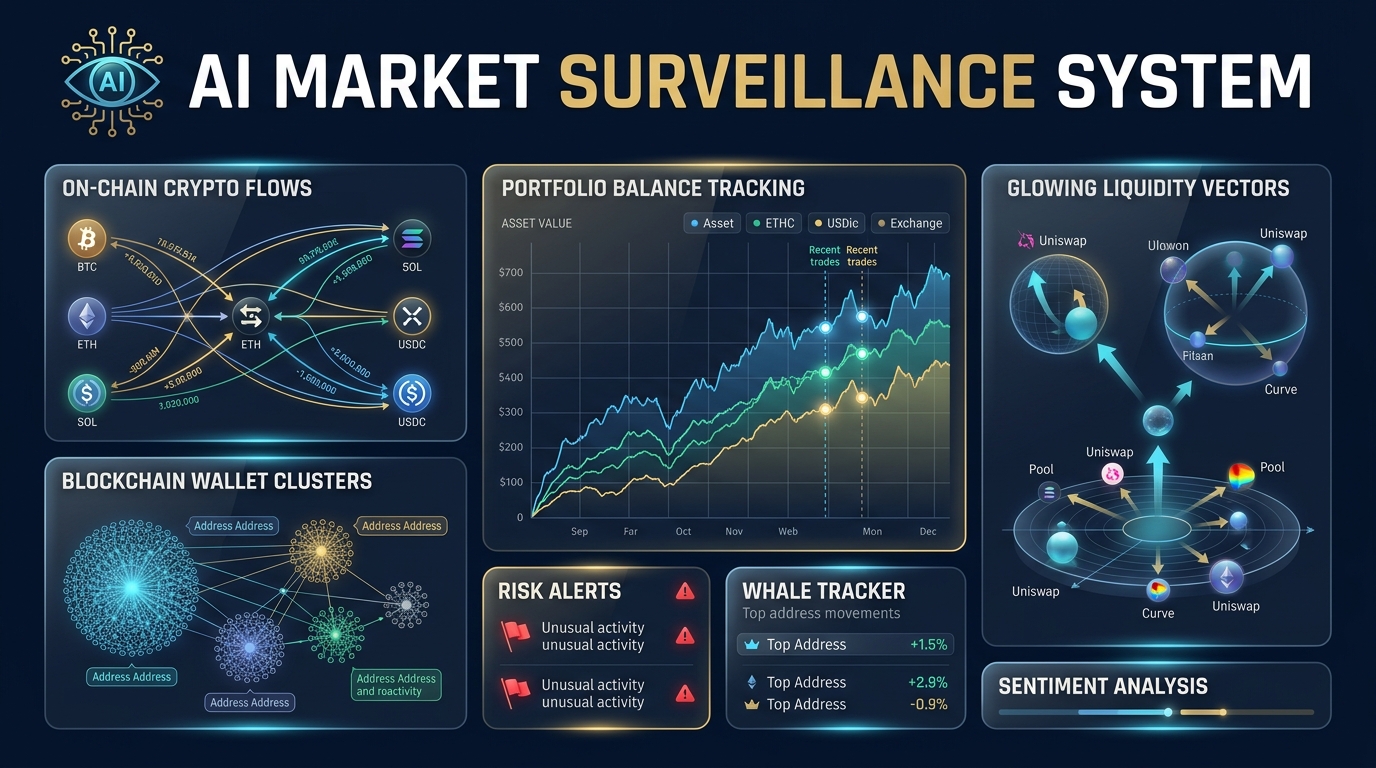
01 MACRO LANDSCAPE Q3/2026: INSTITUTIONAL CAPITAL & ACCUMULATION TRAPS
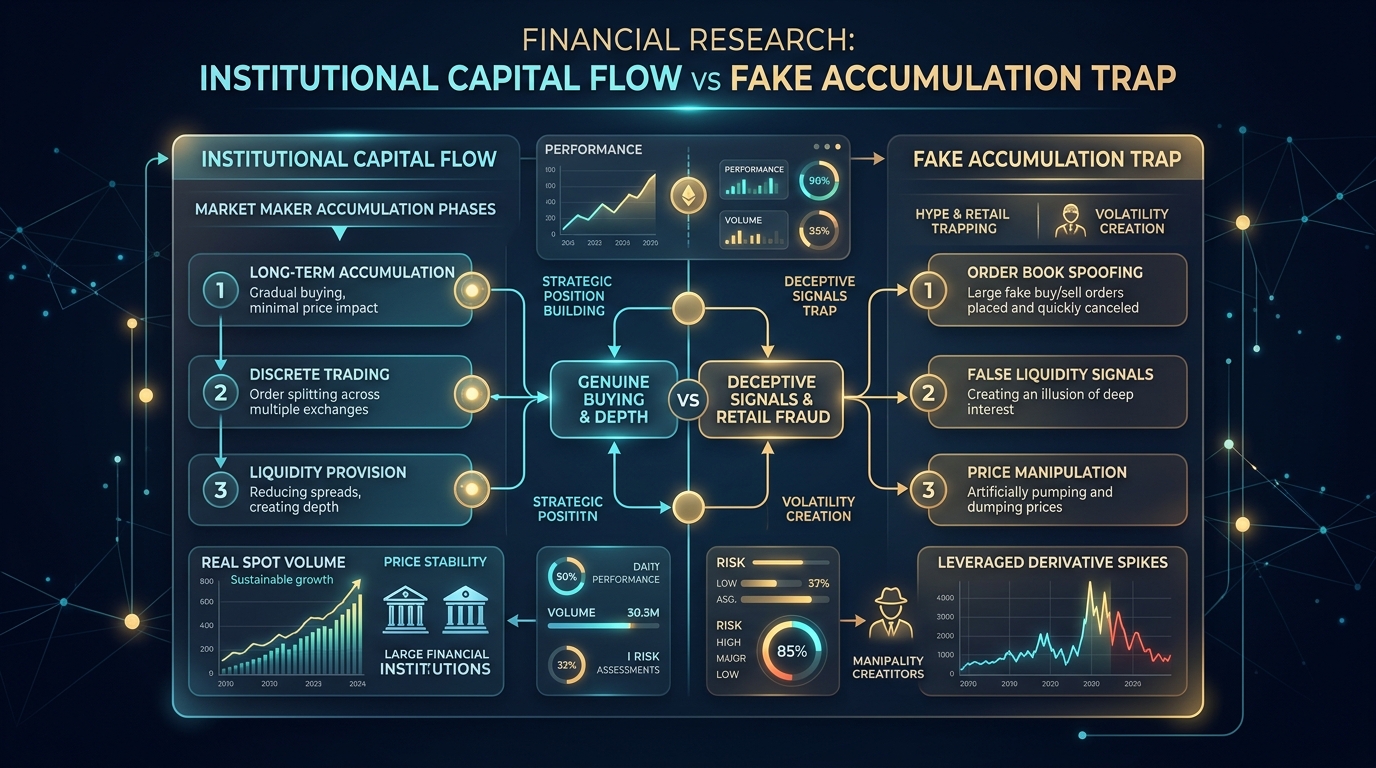
Entering Q3 2026, the digital asset ecosystem is experiencing the most profound structural transition in a decade. The era of synchronized bull runs lifting all speculative tokens has permanently concluded. Inflow metrics from spot ETFs and institutional custody banks demonstrate that organic capital is selectively concentrating into a handful of fundamental store-of-value assets, while the rest of the market is trapped in synthetic liquidity whirlpools.
Modern market makers no longer employ archaic accumulation tactics from previous cycles. Instead, algorithmic execution protocols silently absorb spot supply at deep discount levels while engineering synthetic momentum waves across derivative order books to lure retail liquidity. Traditional candlestick charts often project an illusion of aggressive accumulation; however, forensic separation of spot depth from open interest exposes the underlying reality: spot accumulation remains stagnant while short-term leverage surges to precarious extremes.
The unforgiving law of financial markets dictates that smart money necessitates counterparty exit liquidity for massive position turnover. Distinguishing genuine institutional spot absorption from engineered liquidity traps marks the boundary between portfolio longevity and catastrophic drawdown.
02 ON-CHAIN CAPITAL ANATOMY: SMART MONEY ROUTING & LIQUIDITY MIGRATION
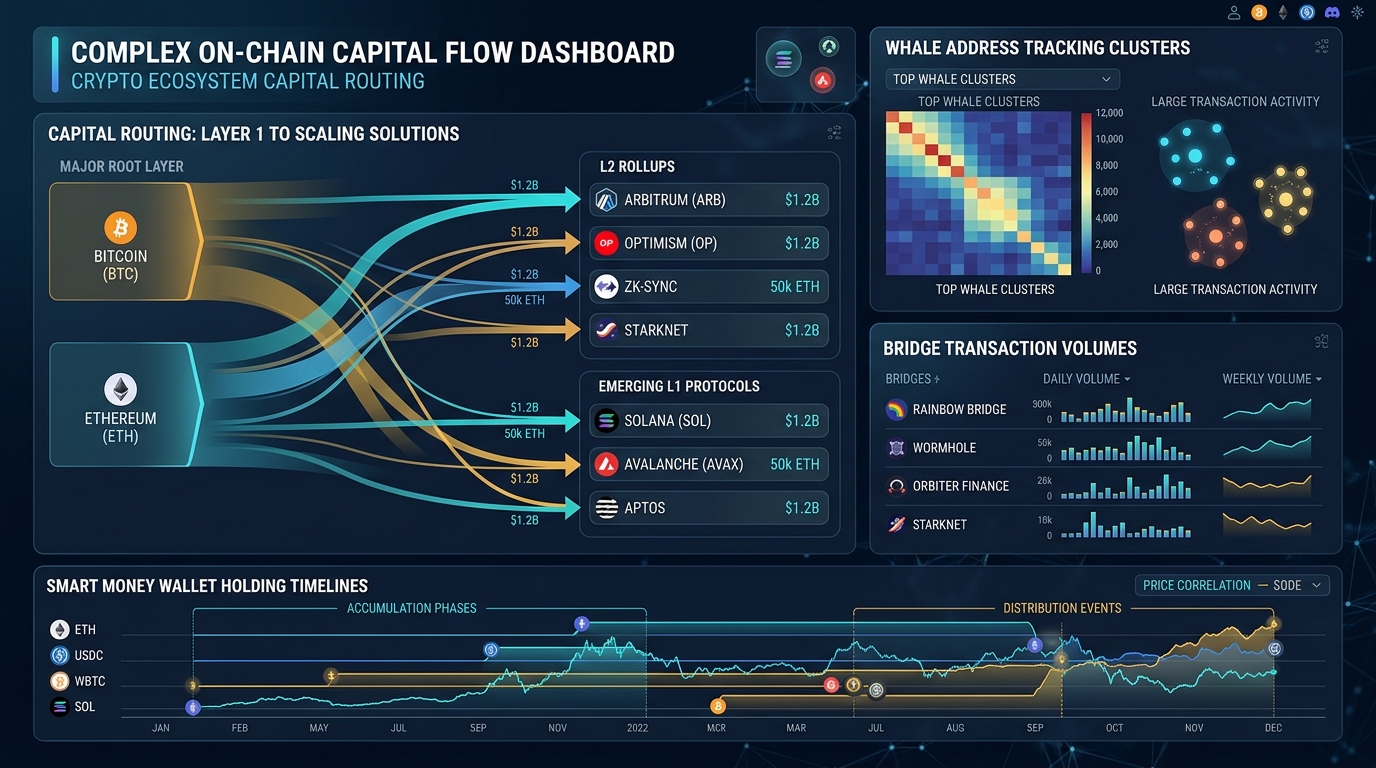
On-chain data serves as the unvarnished ledger of market reality beneath centralized exchange order books. Monitoring balance shifts across whale wallet clusters holding over 1,000 BTC alongside institutional market makers reveals a structured capital rotation: liquidity anchored in base settlement layers (Bitcoin, Ethereum) is systematically redeployed into cost-efficient Layer-2 rollups and high-throughput smart contract ecosystems.
A critical finding this quarter is the sharp decline in capital retention across traditional cross-chain bridges. Rather than locking assets in inflationary yield protocols, smart money operates mercenary capital, harvesting initial emission liquidity before rotating back into sovereign collateral (standardized USD stablecoins). Stablecoin velocity has reached cyclic highs, signaling preparations for substantial volatility and broad asset repricing.
Retail participants frequently obsess over daily spot price action while overlooking on-chain velocity. When an ecosystem rallies without a commensurate expansion of net stablecoin deposits, the price surge is a leveraged mirage; when liquidity departs, severe price collapse follows.
03 TOKENOMICS VULNERABILITIES & HIDDEN DILUTION (RED TEAMING)
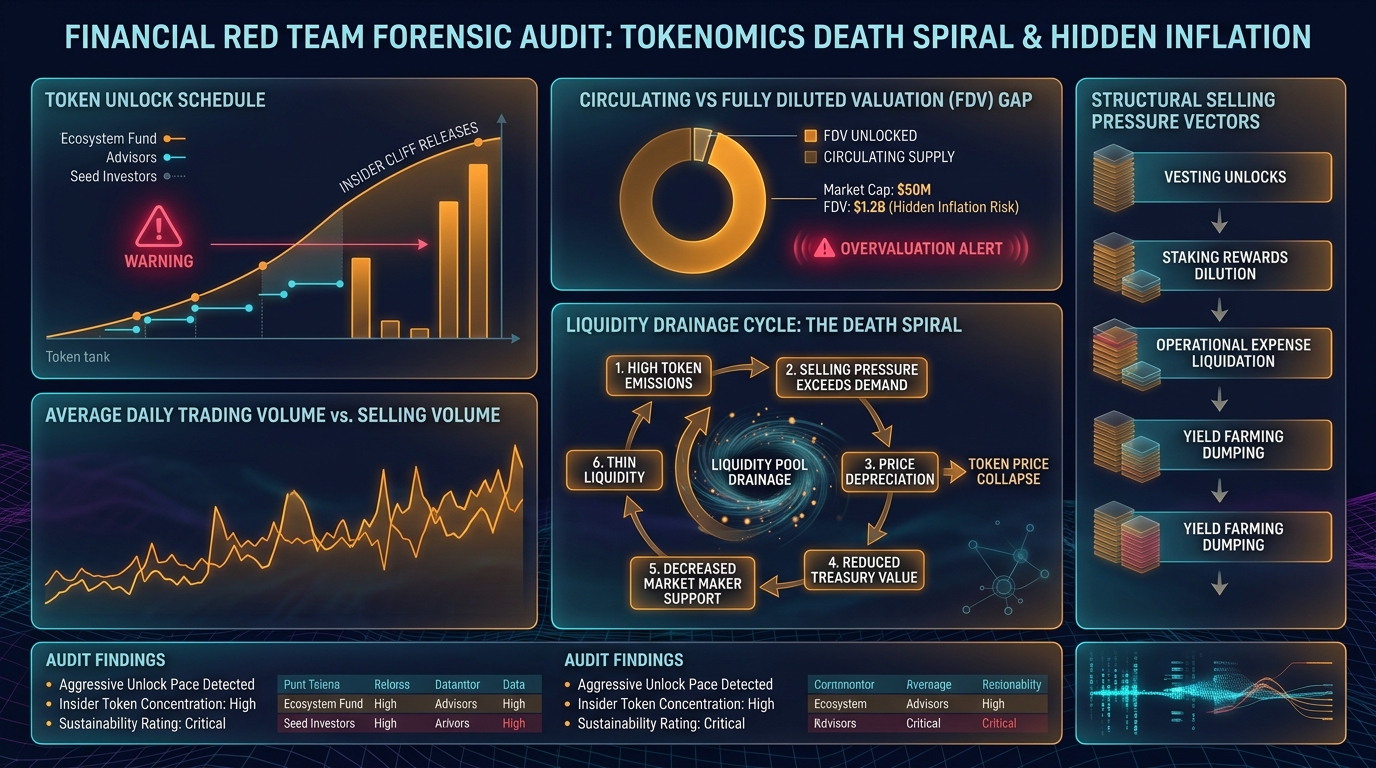
One of the most lethal portfolio traps in the modern crypto market is the low-float, high-FDV tokenomics architecture. Engineered by venture funds and project teams, this structure inflates token prices on minimal initial capital, cultivating a manufactured illusion of multi-billion-dollar enterprise valuation.
Forensic Red Teaming audits across 50 recently launched protocols reveal a severe structural imbalance: scheduled cliff unlock sell pressure from seed investors and advisors drastically exceeds aggregate spot market depth. Daily emissions inject tens of millions of dollars in dilutive supply without matching organic fee revenue or utility demand.
The inevitable outcome is a liquidity death spiral: persistent price depreciation forces early allocators to accelerate divestment, draining AMM pool reserves and inflicting 80% to 95% drawdowns on passive retail holders. Holding tokens with under 25% circulating supply and aggressive 12-month unlock cliffs is tantamount to serving as exit liquidity.
04 LIQUIDITY PARADOX & CLUSTERED STOP-LOSS POOLS
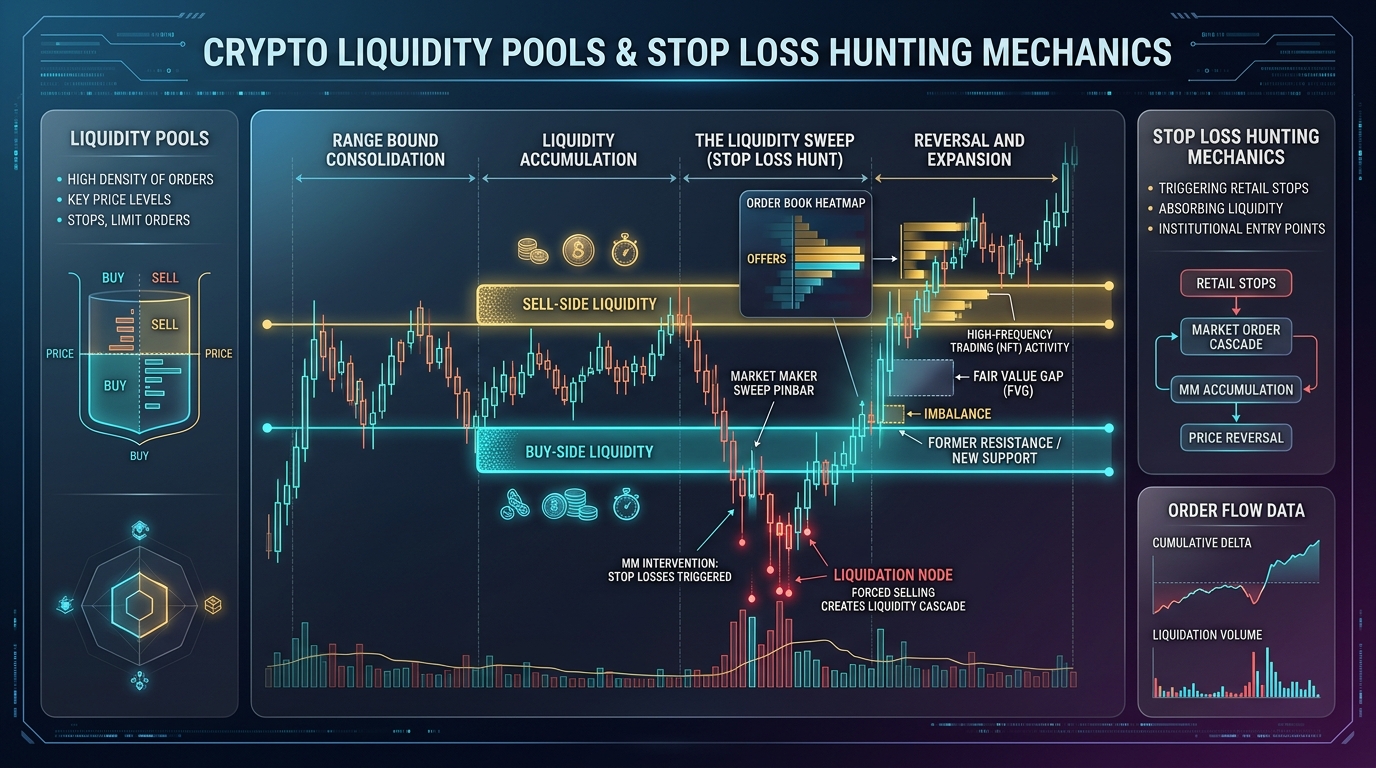
Financial market liquidity does not disperse uniformly; it clusters in dense concentrations above swing highs and below swing lows where retail stop orders aggregate. For institutional block traders, these liquidity pools represent essential execution zones to fill massive orders without incurring prohibitive slippage.
The paradox of liquidity is that obvious technical levels attract heavy stop clustering, making them prime targets for algorithmic sweeps. High-frequency market-making models aggressively breach these thresholds to trigger cascade liquidations, absorbing panicked volume at favorable pricing before immediately initiating sharp mean reversals.
Mastering this liquidity mechanics shifts trader perspective: rather than placing defensive stops at predictable levels, disciplined traders utilize liquidity heatmaps and Fair Value Gaps (FVG) to align entries alongside institutional order flow.
05 PORTFOLIO DRIFT: THE SILENT RETURN KILLER
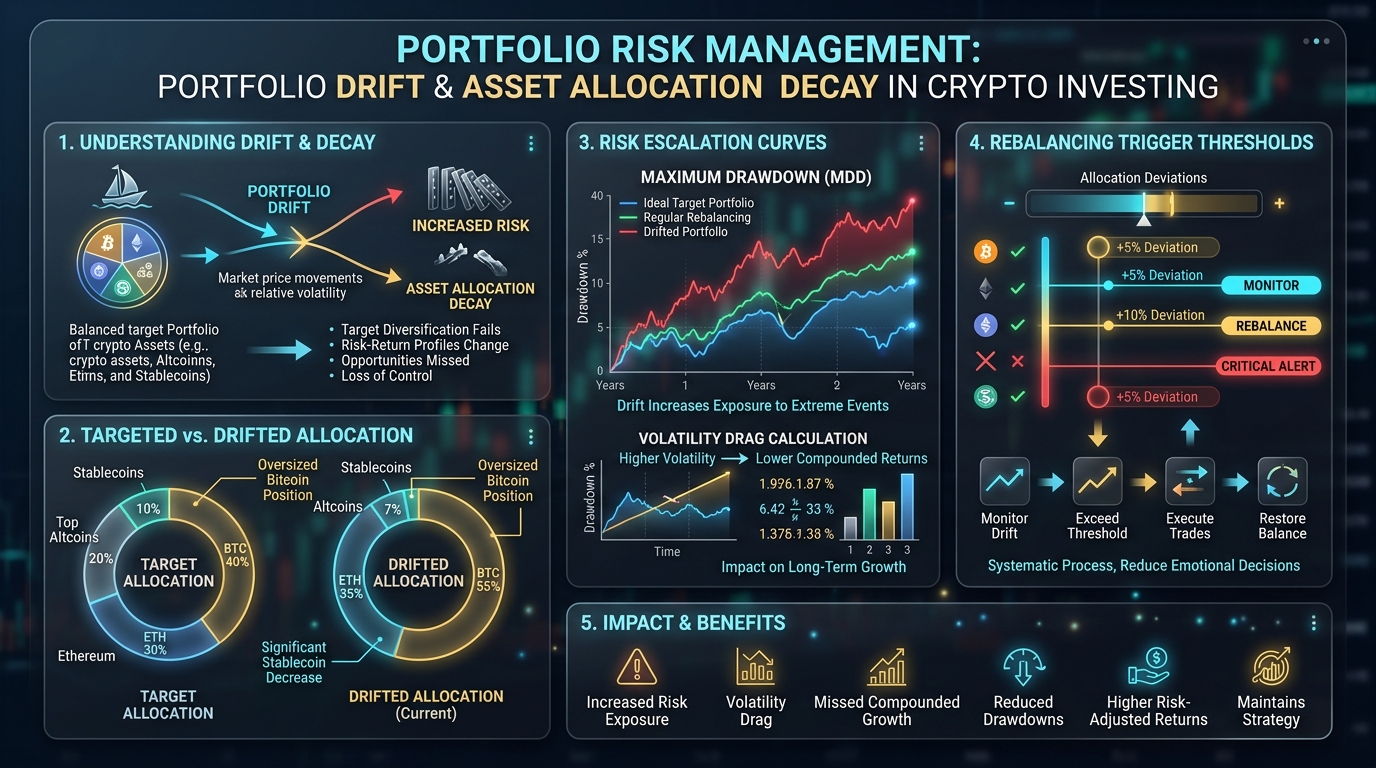
Most investor failures stem from uncontrolled portfolio drift during volatile market expansions. When a high-beta speculative asset appreciates rapidly, its weighting expands from a prudent 5% to 30% or 50% of total capital, warping the investor's baseline risk exposure while emotional bias prevents systematic rebalancing.
As speculative holdings dominate total allocation, the aggregate portfolio risk profile deteriorates. When market pullbacks strike, bloated high-beta positions experience rapid drawdowns. A 70% decline in an asset commanding 40% portfolio weight entirely annihilates years of steady compounding from defensive core holdings.
The arithmetic of drawdown recovery is brutal: a 50% loss requires a 100% gain to break even, while an 80% loss demands a 400% recovery. Failure to systematically rebalance drifted positions is the primary cause of retail capital destruction when market cycles turn.
06 RISK MANAGEMENT FRAMEWORK & GEM FREQUENCY 4-TIER CAPITAL MATRIX
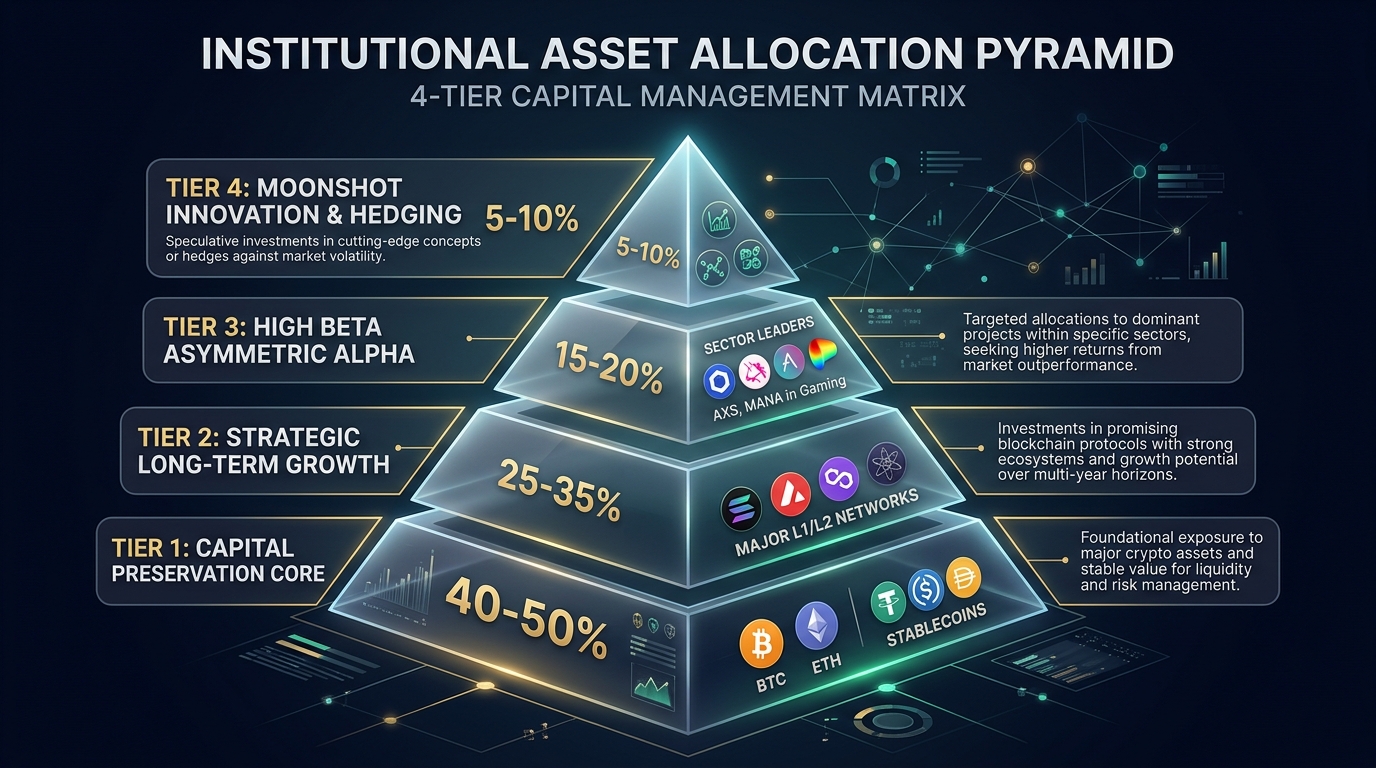
To ensure survival and sustainable compounding across volatile crypto regimes, GEMRAL established the 4-Tier Capital Allocation Matrix (GEM Frequency Capital Matrix), anchoring foundational preservation before targeting alpha:
Capital Preservation Core
Concentrated in Bitcoin, Ethereum, and benchmark USD stablecoins, serving as the portfolio anchor during severe macro liquidity shocks.
Strategic Ecosystem Growth
Allocated to proven Layer-1 and Layer-2 network tokens backed by genuine user adoption, high transaction throughput, and protocol fee generation.
High-Beta Asymmetric Alpha
Invested in category-defining leaders across decentralized AI, modular infrastructure, and high-velocity DeFi protocols offering asymmetric upside.
Moonshot Innovation & Tail Hedging
Reserved for asymmetric early-stage innovation and derivative options designed for tail-risk hedging.
This 4-tier matrix eliminates emotional decision-making. Regardless of market euphoria or panic, strict allocation boundaries insulate the investor from ruinous over-concentration.
07 AI ON-CHAIN SURVEILLANCE & AUTOMATED POSITION DRIFT ALERTS
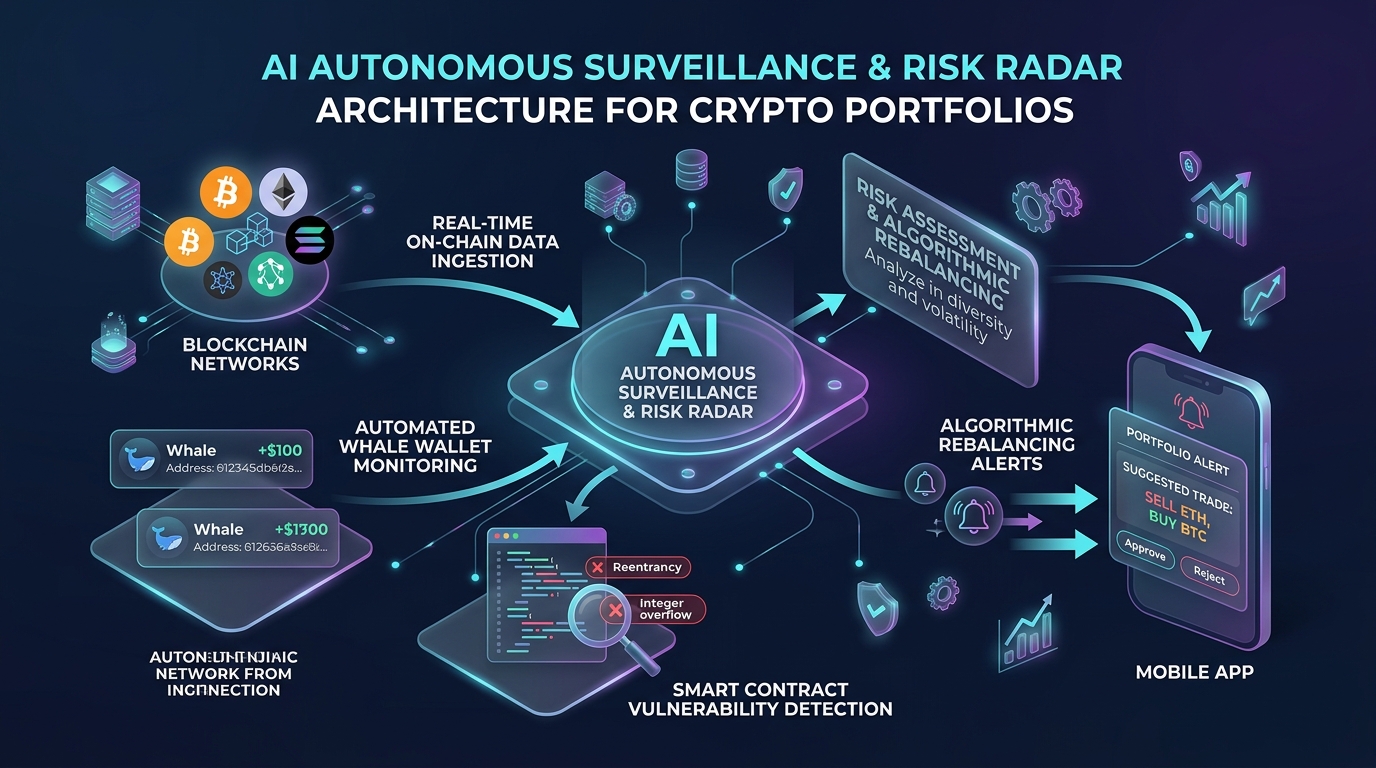
Crypto markets operate 24/7 without market closes. Human traders cannot manually track millions of daily block transactions across dozens of networks. Autonomous AI systems provide disciplined investors with a decisive structural edge.
GEM Scanner solves continuous surveillance by connecting directly to blockchain RPC nodes and Tier-1 exchange APIs. The AI engine continuously analyzes abnormal whale transactions, inspects smart contract bytecode for liquidity drains, and calculates real-time portfolio drift metrics.
When asset allocations exceed predefined tolerance thresholds (e.g. ±5% drift), automated push alerts trigger actionable rebalancing recommendations, empowering investors to harvest profits and fortify defensive cash reserves before market-wide corrections.
08 FORENSIC CASE STUDIES: LIQUIDITY CASCADES & PROTOCOL INSOLVENCY
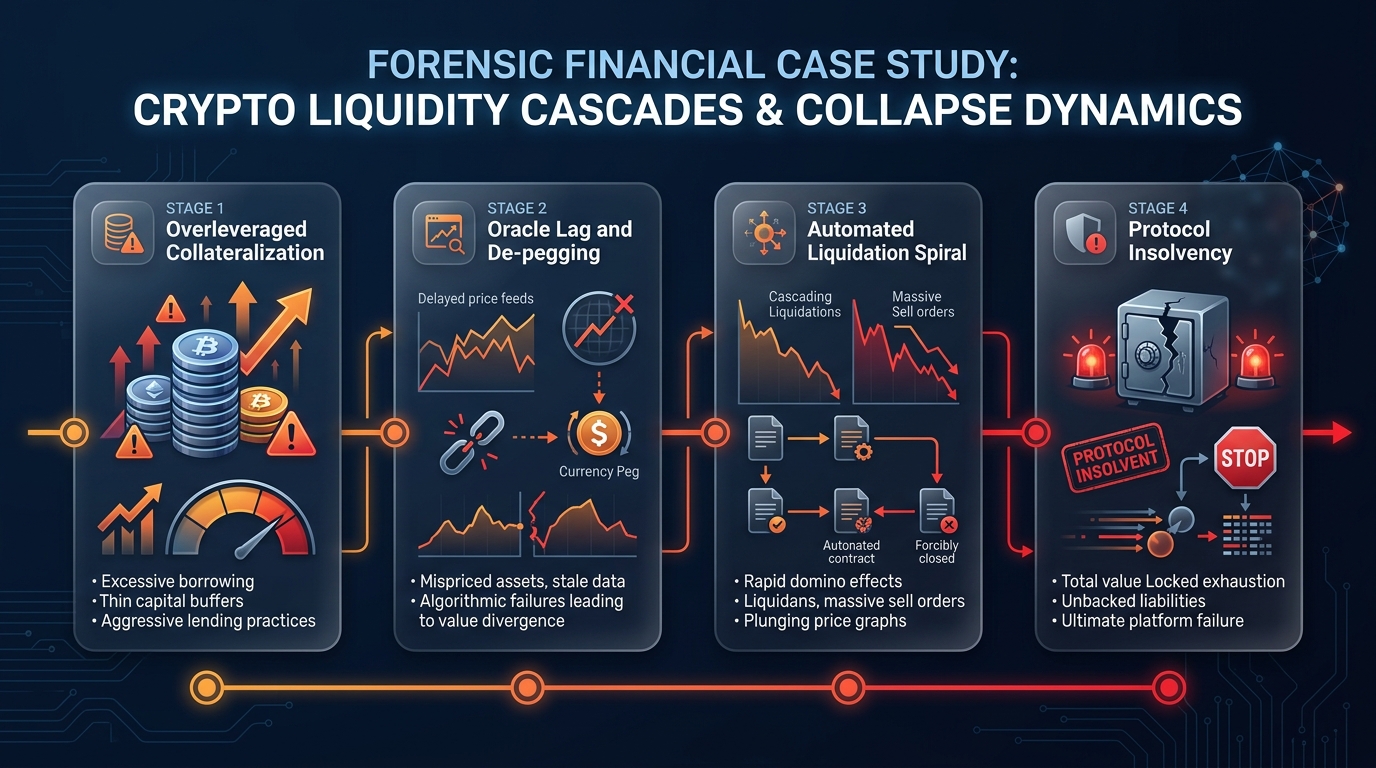
Financial history repeats crises rooted in overconfidence and unhedged liquidity. The systemic collapses of Terra-Luna, Three Arrows Capital, and FTX all stemmed from overleveraged portfolios underpinned by illiquid collateral.
In algorithmic collateral models, balance sheet values appeared robust on paper, but actual on-chain pool depth could absorb less than 5% of aggregate redemptions. Oracle latency compounded by cascading smart contract liquidations triggered death spirals, erasing tens of billions in days.
The paramount takeaway is that standard-market liquidity evaporates during panic. In a crisis, only holders of genuine, unencumbered spot liquidity maintain autonomy and survive.
09 AUTOMATED SYSTEMATIC REBALANCING ROADMAP
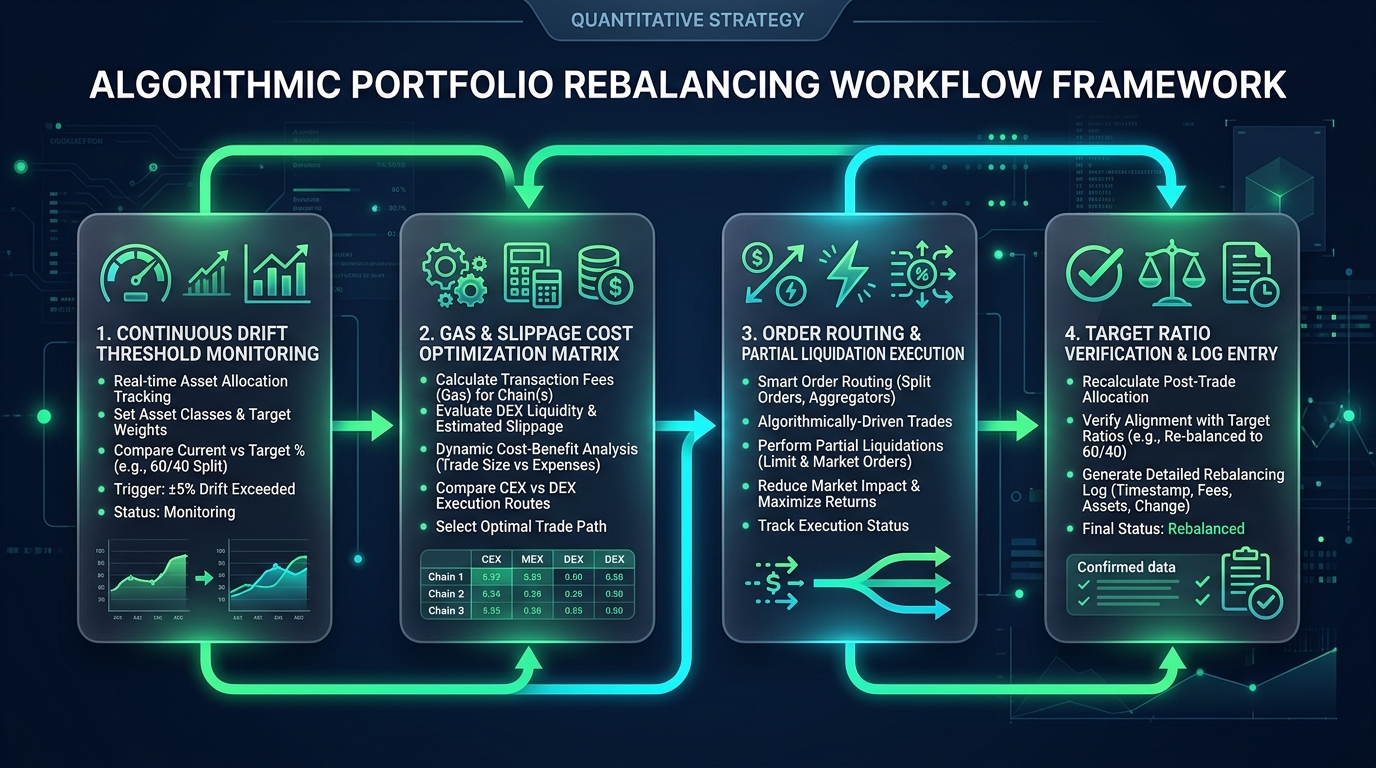
To eliminate emotional friction, investors should transition from discretionary decisions to a structured 4-phase quantitative rebalancing process:
Phase 1: Continuous Drift Threshold Monitoring
Rather than arbitrary calendar intervals that waste transaction fees, rebalancing triggers only when asset drift exceeds tolerance bands (e.g. ±5% from target weights).
Phase 2: Gas & Slippage Cost Optimization Matrix
Quantifies network gas fees and expected execution slippage across DEX and CEX routes to ensure rebalancing value exceeds friction costs.
Phase 3: Smart Order Routing & Partial Execution
Executes order slicing and algorithmic smart routing across venues to minimize market impact and preserve capital.
Phase 4: Target Ratio Verification & Log Entry
Audits final post-trade allocations against targets and records trade data in the investment journal to complete the feedback loop.
Automating this 4-phase workflow removes hesitation, turning profit realization into a mechanical discipline that compounds capital across cycles.
10 5 IMMUTABLE LAWS FOR CAPITAL PRESERVATION & SURVIVAL
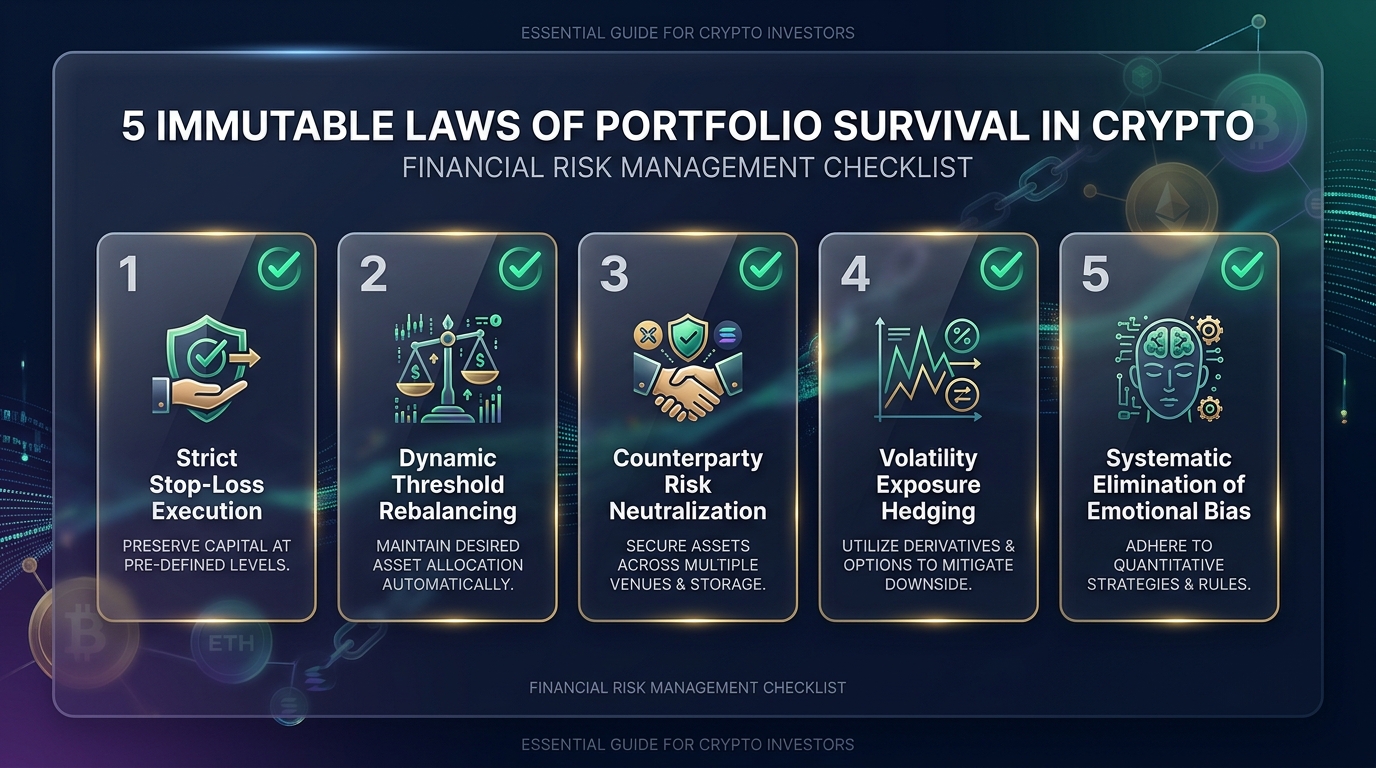
Having audited on-chain flows, liquidity dynamics, and portfolio drift mechanics, long-term survival distills into 5 immutable laws:
1. Strict Structural Stop-Loss Execution
Every trade requires a predetermined technical stop-loss. Never widen stops against an adverse move. Accepting a small predetermined loss is the cheapest insurance for survival.
2. Dynamic Threshold Rebalancing Over Emotion
When an asset surges past its ceiling weight, systematically harvest profits into defensive reserves or undervalued sectors, ignoring emotional greed.
3. Counterparty & Custody Risk Neutralization
Never concentrate capital on a single exchange or wallet. Diversify custody across audited cold storage and transparent reserve venues.
4. Volatility Exposure & Tail-Risk Hedging
Maintain substantial stablecoin cash reserves to exploit extreme black swan liquidation events when high-quality assets trade at fire-sale valuations.
5. Systematic Elimination of Emotional Bias
Rely on quantitative models and autonomous alerts rather than subjective intuition. Removing fear and greed from the execution loop unlocks compounding wealth.
RESEARCH CITATIONS & ON-CHAIN DATA SOURCES (20 REFERENCES)
- 1. Glassnode Studio: On-Chain Capital Flow & Realized Cap HODL Waves Q3/2026.
- 2. Nansen AI: Smart Money Portfolio Tracking & Stablecoin Reserves Index.
- 3. DeFiLlama Analytics: Total Value Locked (TVL) & Protocol Fee Dashboards 2026.
- 4. Token Terminal: Financial Statements & Price-to-Fee (P/F) Benchmark Metrics.
- 5. Artemis Protocol Metrics: Daily Active Addresses & Developer Ecosystem Breakdown.
- 6. CoinGecko Institutional: Global Digital Asset Sector Allocation Report 2026.
- 7. Dune Analytics: Smart Money DEX Swaps & Liquidity Pool Flow Repositories.
- 8. Santiment: Mean Dollar Invested Age & Dormant Circulation Velocity Spikes.
- 9. IntoTheBlock Intelligence: In/Out of the Money Around Price Concentration.
- 10. CryptoQuant: Exchange Reserve Net Inflows & Miner Outflow Index 2026.
- 11. Etherscan & Solscan: Whale Transaction Cluster Analysis & Bridge Tracking.
- 12. Messari Research: Crypto Theses Q3/2026 — Infrastructure vs Application Layer.
- 13. Bank for International Settlements (BIS): Algorithmic Rebalancing Working Papers.
- 14. Cambridge Centre for Alternative Finance: Institutional Digital Asset Flow Report.
- 15. CoinShares Weekly: Fund Flows & Digital Asset Asset Allocation Trends.
- 16. The Block Research: Layer-1 vs Layer-2 Gas Consumption & Revenue Dynamics.
- 17. Chainalysis: Liquidity Pool Manipulation & Forensic On-Chain Investigations.
- 18. Kaiko Research: Market Depth & Order Book Slippage Across Venues.
- 19. Binance Research: Portfolio Diversification & Maximum Drawdown Mitigation.
- 20. Robert Greene: The 48 Laws of Power & The 33 Strategies of War (Mastery of Market Posture).
This research report is prepared by the GEMRAL quantitative research team solely for informational and educational purposes. Nothing herein constitutes financial, investment, or legal advice, nor an endorsement or solicitation to trade digital assets. Cryptocurrency investments entail high volatility and capital risk. Investors bear full personal responsibility for their capital allocation and risk management.
End Emotional Discretionary Trading,
Master On-Chain Flows & Build Enduring Edge!
Master battle-tested quantitative risk management with the GEM Trading Starter Course, paired with 24/7 autonomous pattern and on-chain flow scanning via the GEM Scanner mobile app.