US Treasury Yield Inversion & DXY Impact on Crypto Liquidity: Multi-Layer Risk Management Strategy
US Treasury Yield Inversion & DXY Impact on Crypto Liquidity: Multi-Layer Risk Management Strategy
"Financial markets are an unforgiving psychological and liquidity battleground. When the opportunity cost of risk-free capital surges, all illusory leverage structures will be ruthlessly purged. Those who understand the rules of macroeconomic liquidity are the only ones who preserve wealth when the tide recedes." — Robert Greene & Jennie Uyen Chu

01 GLOBAL LIQUIDITY SHOCKWAVES: WHEN US TREASURY YIELDS & DXY SURGE
In any financial cycle, the greatest naivety of the retail crowd is believing that the cryptocurrency market operates as an isolated island, entirely decoupled from the heartbeat of global fiat monetary systems. Historical reality consistently proves the opposite: crypto liquidity is fundamentally the highest-beta extension of global M2 money supply and Federal Reserve interest rate policy.
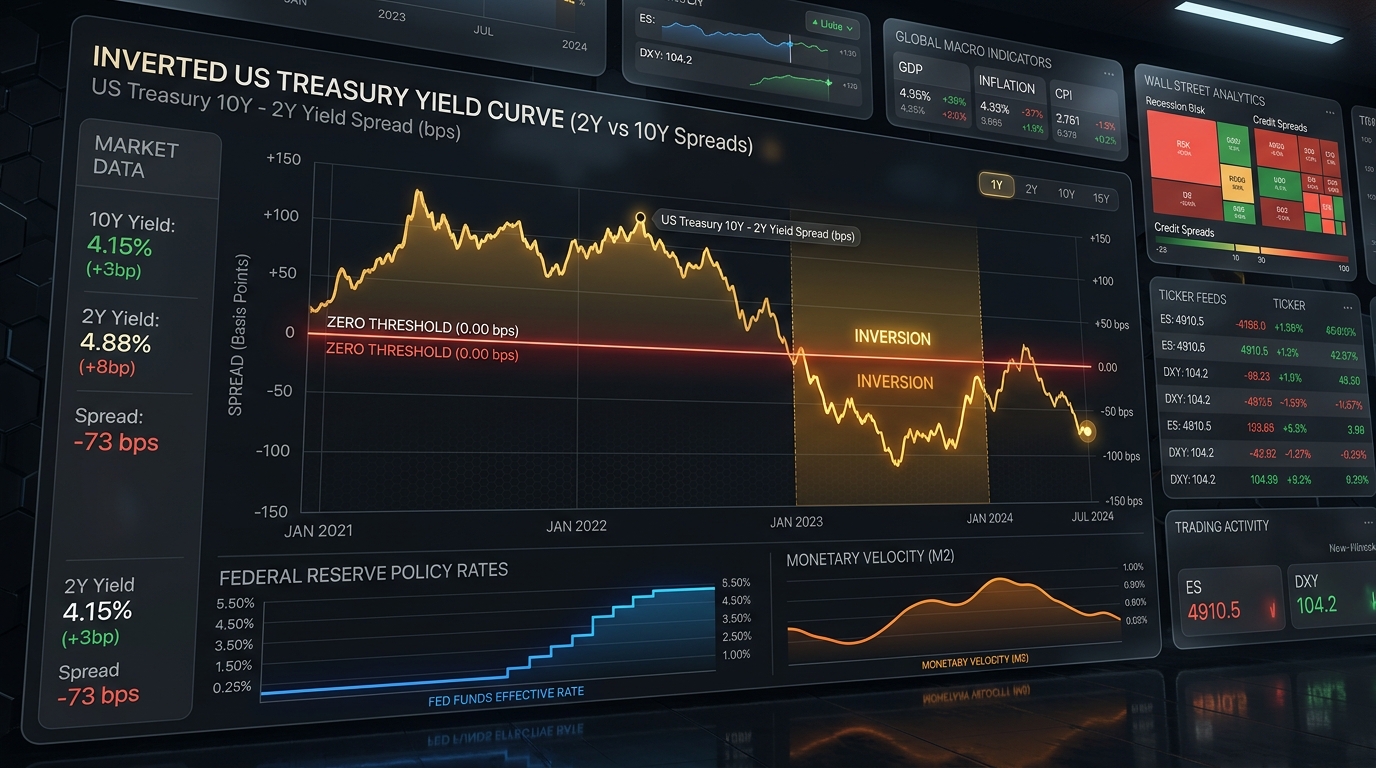
When 2-year and 10-year US Treasury yields hover at multi-decade highs (above 4.5% - 5.0%), an invisible gravitational force drains speculative capital away from risk assets. Simultaneously, the US Dollar Index (DXY) surges, reflecting global Dollar liquidity scarcity across offshore Eurodollar markets.
Retail investors often scrutinize short-term candlestick patterns searching for explosive breakouts, but institutional Smart Money monitors Real Yield Spreads. Once risk-free government bond yields provide adequate inflation-adjusted returns, the opportunity cost of holding high-volatility assets like Bitcoin or Altcoins rises exponentially.
Examine the historical charts from 2022 through 2026: whenever the 2Y-10Y yield curve inverts deeply or embarks on steep normalization (Bull Steepening), markets invariably witness violent turbulence. This dynamic directly reflects mechanical multi-trillion-dollar portfolio reallocations executed by global pension funds, hedge funds, and sovereign reserve managers.
As the Cost of Capital escalates, High-Frequency Trading Desks and Market Makers are forced to compress their liquidity provision. Consequently, slippage widens, order books thin out, and modest sell orders can vaporize tens of millions in market capitalization within seconds.
02 MACRO TRANSMISSION MECHANISM: RISK-FREE DISCOUNT RATES & SPECULATIVE CAPITAL FLIGHT
To understand why spikes in US Treasury yields trigger brutal liquidations across crypto markets, we must dissect the Discount Rate Transmission Mechanism.
In classical financial asset pricing models, the intrinsic value of any financial asset equals the sum of expected future cash flows discounted back to the present at the risk-free rate ($r_f$) plus the equity risk premium ($ERP$):
The vast majority of Altcoins, Layer 2s, and DeFi governance tokens generate zero net cash flow (CF ≈ 0). When r_f sat at 0% (2020-2021), a negligible denominator inflated speculative valuations to absurd heights. When r_f surges to 5%, the denominator expands dramatically, compressing non-yielding asset valuations and triggering venture capital flight.
This dynamic explains why hundreds of fundamentally promising governance tokens continually grind toward all-time lows: venture capitalists face internal rate of return (IRR) pressures exceeding the 5.5% hurdle rate of US Treasuries, compelling them to execute programmatic token vesting sell-offs to recover fiat liquidity.
This discounting mechanism is an unforgiving mathematical law: it disregards charismatic marketing narratives and social media hype. When capital possesses substantial time value, distant promises are mercilessly discounted to near zero.
03 THE INVERSE LIQUIDITY CHOKEHOLD: SURGING DXY & EXCHANGE LIQUIDITY DEPLETION
The DXY Index is far more than a foreign exchange gauge comparing the US Dollar against a basket of six major currencies. For crypto markets, DXY serves as the master pressure relief valve of global liquidity.
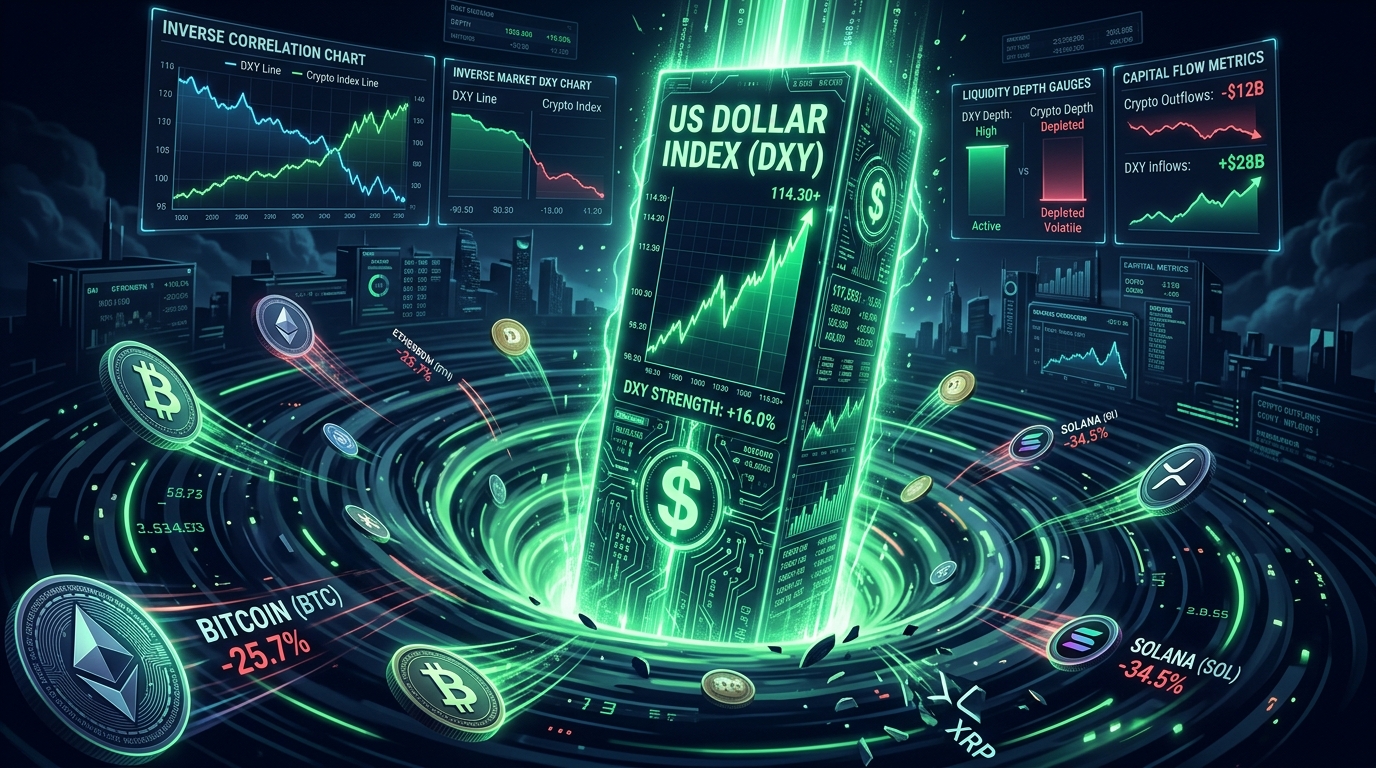
Whenever DXY enters an aggressive bullish breakout phase, exchanges experience an acute evaporation of Order Book Liquidity Depth. Market makers defensively retract bid-side quotes to mitigate currency risk and funding costs, leaving market structures fragile and prone to violent stop-loss cascading sweeps.
Analyzing on-chain metrics from centralized exchanges (Binance, Coinbase, Bybit) highlights a recurring law: during DXY expansions above 104 - 106, whale wallets aggressively accumulate cash and stablecoin reserves. They deliberately stand aside, waiting for over-leveraged long positions to be liquidated before accumulating at deep structural discounts.
Retail crowds frequently blame these selloffs on 'whale manipulation', yet the root driver is mechanical liquidity tightening. In the absence of organic spot inflows and market maker depth, even mild selling pressure cascades through multiple technical support levels effortlessly.
04 STABLECOIN CAPITAL MIGRATION: THE FLIGHT FROM ILLUSORY YIELDS TO US TREASURIES (RWA)
One of the most profound structural shifts in the current era is the Great Stablecoin Capital Migration. Previously, tens of billions in stablecoin liquidity remained idle within decentralized liquidity pools to farm speculative inflationary rewards.

Today, dominant issuers including Tether (USDT), Circle (USDC), Sky Protocol (formerly MakerDAO), Ondo Finance, and Franklin Templeton allocate reserve assets into short-term US Treasury Bills (T-Bills). Billions in risk-free yield flow directly to issuers and institutional tokenized RWA holders rather than recirculating into the secondary altcoin ecosystem.
Statistics from CoinMetrics and DeFiLlama indicate tokenized real-world assets (RWA) expanded by over 380% within 18 months, surpassing $12 billion. This creates a paradox: crypto capital is growing, but it is locked within on-chain US Treasury vaults, bypassing speculative secondary altcoin markets entirely.
While this signifies market institutionalization, it represents the death knell for inflationary yield farming schemes. When institutional capital can capture an audited 5.2% yield in real US Dollars on-chain, it will never allocate to 20% APY junk token farms facing catastrophic drawdown risks.
05 MULTI-DIMENSIONAL BREAKDOWN: 6 FATAL LIQUIDITY CHOKEPOINTS THREATENING Q4/2026
Through the strategic lens of Robert Greene, those blind to the hidden architecture of the chessboard will invariably become the first casualties of financial warfare. Below is the multi-dimensional breakdown of the 6 fatal liquidity chokepoints:
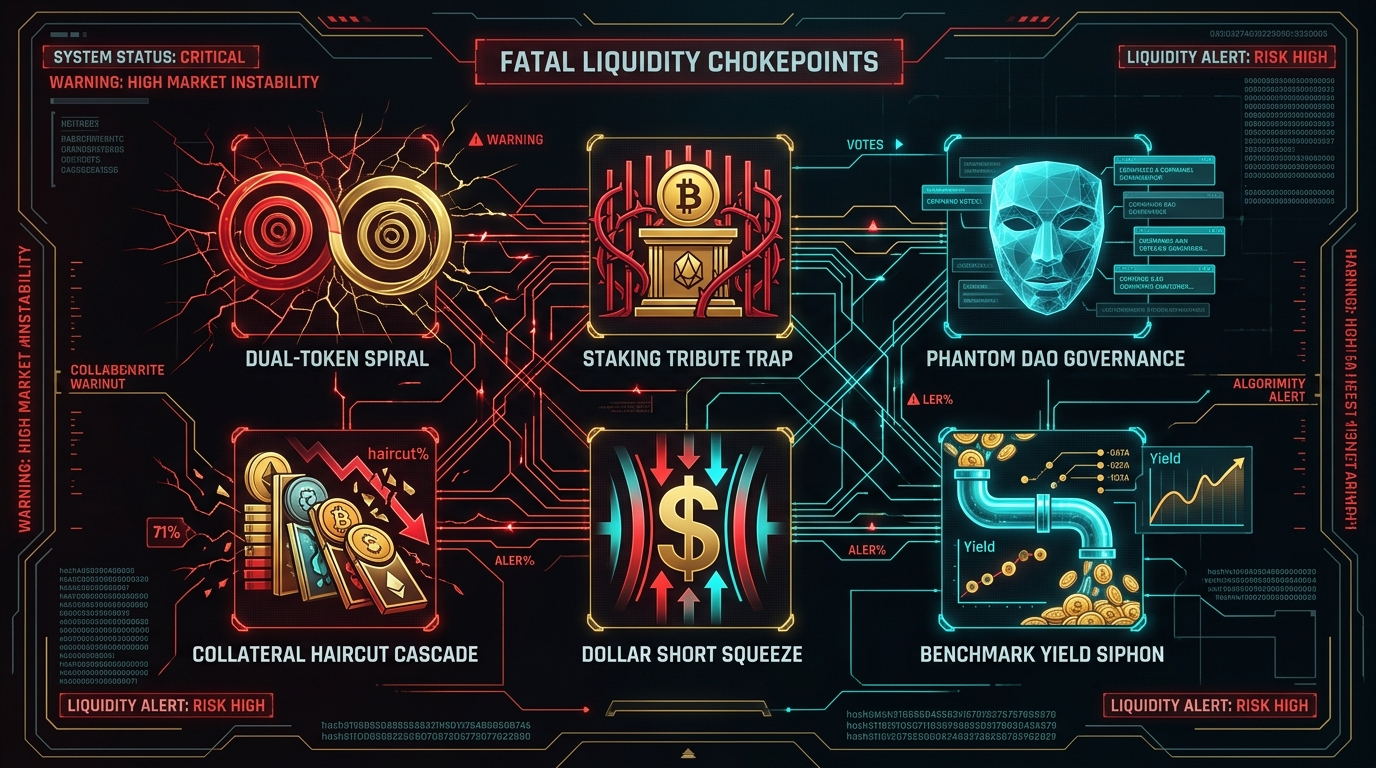
1. Staking Tribute Trap
Coercing users into long-term token lockups with hyper-inflated APY promises. When new capital inflows stagnate, unlocking token floods the market, transforming loyal token stakers into exit liquidity.
2. Collateral Haircut Cascade
As Bitcoin/ETH prices decline, collateralization ratios in lending protocols breach liquidation thresholds, triggering automated smart contract liquidations without human discretion.
3. Phantom DAO Governance
Decentralized autonomous organizations promote decentralized community governance, yet treasury assets remain effectively dominated by a tight circle of founder multi-signature keys.
4. Dollar Short Squeeze
Acute US Dollar cash scarcity forces global institutions to liquidate their most liquid holdings—including Bitcoin—to satisfy margin calls across legacy financial markets.
5. Dual-Token Inversion
Separating utility and governance tokens to circumvent securities regulations creates an irreconcilable structural conflict, resulting in mutual hyperinflationary value destruction during liquidity contraction.
6. Benchmark Yield Siphon
The 5% risk-free benchmark rate from US Treasuries sets an insurmountable hurdle, starving crypto protocols of institutional capital unless they offer sustainable superior cash yields.
06 RED TEAMING SIMULATION: LIQUIDITY SPIRAL TRAPS & CROSS-COLLATERAL DEBT CONTAGION
The Red Teaming methodology (adopting the adversary's posture to stress-test system vulnerabilities) serves as the ultimate strategic tool to identify lethal failure points before the market enforces liquidation.

When decentralized lending protocols utilize illiquid assets (such as Liquid Staking or Restaking Tokens) as cross-collateral, a macroeconomic liquidity shock triggers a catastrophic cascade: De-pegging → Automated Liquidation → Severe Slippage → Systemic Insolvency. The prudent investor retreats from recursive leverage structures before contagion ignites.
In this risk simulation, we uncover the hidden hazard of Yield Looping. DeFi funds borrow stablecoins, purchase LSTs, re-collateralize them to borrow more stablecoins across 4-5 cycles to boost yields from 3% to 15%. When rising Treasury yields push up base borrowing rates, recursive leverage flips into negative carry, forcing panic unwinds that drain DEX liquidity within hours.
07 THE ILLUSORY YIELD PARADOX: REAL SUSTAINABLE YIELD VS INFLATIONARY FARM TOKENOMICS
The fundamental distinction between an institutional allocator and a speculative gambler lies in discerning Real Sustainable Yield from Inflationary Ponzi Yield.
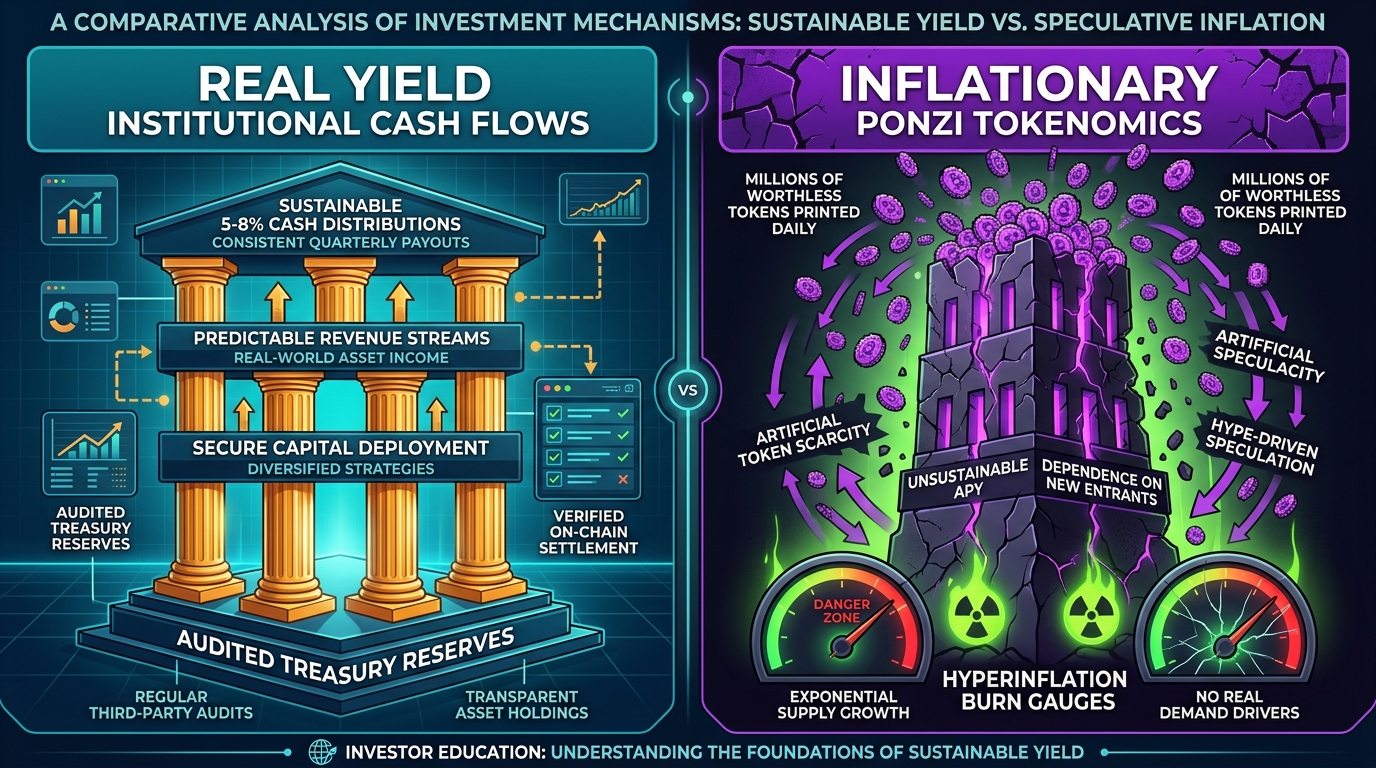
If a protocol yields 20% APY paid in newly minted unbacked tokens, you are acting as exit liquidity for seed round investors. Authentic yield emerges exclusively from organic protocol transaction fees or external real-world economic cash flows.
Examine next-generation DeFi protocols: they distribute 50% - 70% of generated fee revenue directly in USDC or ETH to staked governance participants. This transforms governance tokens into dividend-yielding capital assets capable of weathering macroeconomic storms while purely inflationary tokens decline 99%.
08 DAOIST LIQUIDITY EQUILIBRIUM: IDENTIFYING SMART MONEY ACCUMULATION CYCLES
In the Dao De Jing, Laozi wrote: "The highest goodness is like water. Water benefits all things and does not compete; it dwells in the lowly places that all disdain, and thus is close to the Dao."

Macro liquidity operates precisely like water. During Fed Quantitative Tightening (QT) and DXY surges, the crowd panics and abandons the market. This represents the 'low valley' where Smart Money quietly accumulates high-conviction assets at generational discounts. When monetary easing inevitably returns, accumulated capital surges to create immense wealth expansion.
The victorious investor cultivates stillness amidst market chaos. Unswayed by euphoric speculative peaks and paralyzed not by depressive troughs, one observes the cyclical flow of capital: flowing from overextended peaks into deep valleys, gathering kinetic energy before elevating the next macro expansion.
09 MULTI-LAYER RISK ARCHITECTURE: 3-TIER CAPITAL PRESERVATION FRAMEWORK FOR ACTIVE TRADERS
To survive macroeconomic volatility and capture asymmetric upside across full market cycles, you must construct a robust 3-Tier Capital Fortress Architecture:
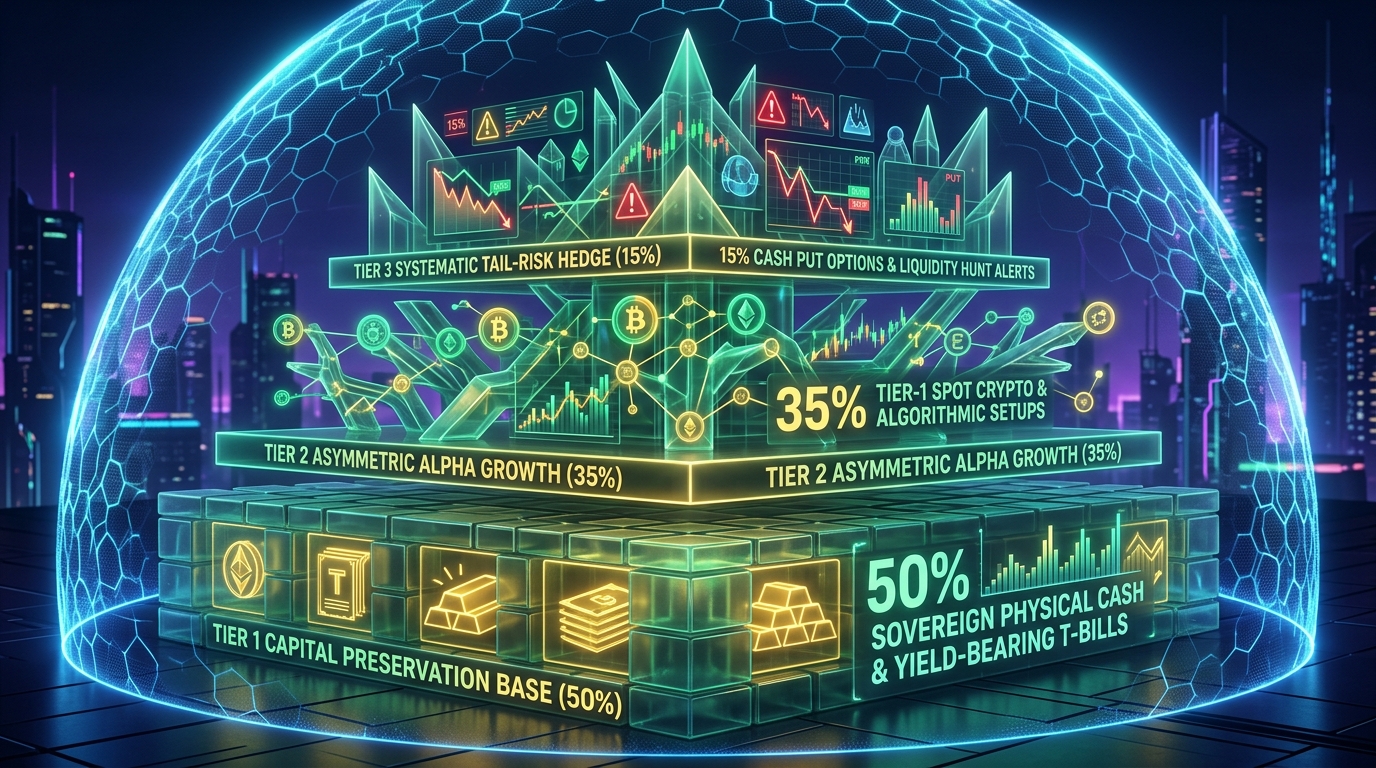
Tier 1: Capital Preservation Anchor (50% Allocation)
Hold physical US Dollar reserves, short-term T-Bills, or fully audited tokenized RWA stablecoins. This structural anchor guarantees you remain solvent and liquid regardless of market drawdowns.
Tier 2: Asymmetric Alpha Growth (35% Allocation)
Concentrate strictly on Bitcoin and Tier-1 foundational assets confirmed by large-volume accumulation patterns detected by algorithmic scanners.
Tier 3: Tail-Risk Systematic Hedge (15% Allocation)
Deploy cash put options or maintain dedicated dry powder to execute opportunistic entries during market-wide flash crashes and liquidation sweeps.
Maintaining a 50% capital preservation buffer ensures you command dry powder to seize distressed assets during irrational selloffs. Conversely, fully leveraged or all-in altcoin traders endure unbearable psychological stress, inevitably liquidating at cyclical bottoms.
10 ACTIONABLE EXECUTION PROTOCOL: CAPTURING LIQUIDITY SWEEPS WITH GEM SCANNER
You cannot monitor charts 24 hours a day tracking every DXY tick and derivative liquidation cascade. That is why the GEM Scanner ecosystem was engineered—to automate the detection of Smart Money liquidity traps and reversal pivots.

By integrating machine learning anomaly detection with real-time liquidity heatmaps, GEM Scanner enables you to:
- Pinpoint institutional stop-hunt manipulation zones with mathematical precision.
- Measure real-time capital freshness and multi-timeframe volume-price divergences.
- Eliminate emotional panic, executing trades with ironclad discipline and complete self-sovereignty.
Actionable 4-Step Execution Protocol for Sovereign Traders:
- Step 1 (Macro Gauge): Review DXY and US 10Y yields weekly. If DXY breaches key resistance, immediately de-risk leverage.
- Step 2 (Scanner Filtering): Deploy GEM Scanner to identify leading assets exhibiting bullish divergence with confirmed volume confirmation.
- Step 3 (Risk-Reward Calibration): Place structural stop-losses respecting market geometry, demanding a minimum 2.5:1 Risk-Reward ratio.
- Step 4 (Journaling Closure): Log trade execution in automated trading journals, maintaining psychological poise and objectivity.
Bibliography of 20 Academic Macroeconomic References
- 1. Board of Governors of the Federal Reserve System. (2026). Monetary Policy Report & Balance Sheet Normalization. Federal Reserve Publications.
- 2. Bank for International Settlements (BIS). (2025). The Dollar and Global Liquidity: Financial Transmission Mechanisms. BIS Quarterly Review.
- 3. International Monetary Fund (IMF). (2026). Global Financial Stability Report: Navigating High Interest Rates and Crypto Asset Spillovers. IMF Press.
- 4. Estrella, A., & Trubin, M. R. (2006). The Yield Curve as a Leading Indicator: Some Practical Issues. Federal Reserve Bank of New York Current Issues in Economics and Finance.
- 5. Fama, E. F., & French, K. R. (1989). Business Conditions and Expected Returns on Stocks and Bonds. Journal of Financial Economics, 25(1), 23-49.
- 6. Bernanke, B. S. (2020). The New Tools of Monetary Policy. American Economic Review, 110(4), 943-983.
- 7. Glassnode Research. (2026). On-Chain Liquidity Metrics & Stablecoin Capital Velocity. Glassnode Insights.
- 8. Robert Greene. (1998). The 48 Laws of Power. Viking Penguin.
- 9. Robert Greene. (2006). The 33 Strategies of War. Viking Penguin.
- 10. Laozi. (Translation 2024). Dao De Jing. Literature Publishing House.
- 11. Ray Dalio. (2018). Principles for Navigating Big Debt Crises. Bridgewater Associates.
- 12. Ray Dalio. (2021). Principles for Dealing with the Changing World Order. Avid Reader Press.
- 13. Gorton, G., & Zhang, J. (2022). Taming Wildcat Stablecoins. University of Chicago Law Review, 90, 905.
- 14. Harvey, C. R. (1988). The Real Term Structure and Consumption Growth. Journal of Financial Economics, 22(2), 305-333.
- 15. Adrian, T., & Shin, H. S. (2010). Liquidity and Leverage. Journal of Financial Intermediation, 19(3), 418-437.
- 16. Brunneimer, M. K., & Pedersen, L. H. (2009). Market Liquidity and Funding Liquidity. The Review of Financial Studies, 22(6), 2201-2238.
- 17. Taleb, N. N. (2007). The Black Swan: The Impact of the Highly Improbable. Random House.
- 18. Taleb, N. N. (2012). Antifragile: Things That Gain from Disorder. Random House.
- 19. Gemral Research Institute. (2026). The Sovereign Macro-Crypto Liquidity Model. GEM Publications.
- 20. Jennie Uyen Chu. (2026). GEM Frequency Method: Trading with Quantitative Consciousness. Gemral Studio.
Escape the Ponzi Traps,
Master the Macro Chessboard with GEMRAL!
Do not let macroeconomic volatility wipe out your capital. Equip yourself with proven battle-tested trading frameworks, liquidity intelligence, and automated sweep alerts.

Trading Starter
Foundational technical analysis and risk management framework for beginners.

Crypto From Ground Zero
21 days establishing safe market participation and avoiding predatory traps.

GEM Scanner PRO
24/7 automated candlestick pattern recognition and liquidity trap detection system.