The Four-Quadrant Trade Classification Matrix: Auditing Your Trading Journal & Decoding Bad Wins
The Four-Quadrant Trade Classification Matrix: Auditing Your Trading Journal & Decoding Bad Wins
Explore the nature of Outcome Bias in financial markets, dissect the 4-quadrant trade execution matrix, and understand why undisciplined profits pose the greatest threat to account longevity.

Figure 1: The structured workspace of a disciplined trader, where every execution is objectively classified across the 4 quadrants.
Core Highlights (Key Takeaways)
- • Outcome Bias (Resulting): Evaluating a trade decision solely by profit or loss is the most dangerous trap for market participants.
- • The 4-Quadrant Matrix: Strictly separates the Process Axis (Disciplined vs Sloppy) from the Outcome Axis (Win vs Loss).
- • The Threat of Quadrant 4 (Bad Wins): Profits generated through reckless execution act as poison disguised as candy, reinforcing lethal habits that guarantee future blowups.
- • Operating Cost (Disciplined Losses): A losing trade executed strictly according to plan is simply a standard cost of doing business in a probabilistic endeavor.
- • DER Protocol: Build the habit of maintaining a Discipline Execution Ratio above 90% for compounding growth.
Table of Contents
1. Opening Story: The Winning Illusion of the Reckless Trader
On a weekend evening in 2024, a group of young traders gathered at a city center cafe. The room erupted in applause when one trader showed his phone screen displaying an $8,000 profit closed within 20 minutes. Across social channels, praise flowed in. He was lauded as a market prodigy.
However, when analyzing the underlying execution logs, the reality was stark: the trade had zero risk management. He used 50x leverage, risked over 60% of his total account equity, and entered solely due to a sudden green impulse spike. Price had come within 0.3% of total liquidation before breaking news triggered a reversal that bailed him out.
"In the eyes of the untrained crowd, it looked like a brilliant victory. But through the lens of quantitative probability, he had just stepped firmly onto the path of bankruptcy."
— Jennie Uyen ChuTwo weeks later, during a standard Bitcoin retracement, the same trader repeated the exact martingale averaging behavior. This time, no miracle occurred. The market continued lower, and the entire $8,000 profit plus his multi-year principal disappeared in a single morning.
2. Outcome Bias: Why We Confuse Luck with Skill
In cognitive psychology and behavioral economics, this is known as Outcome Bias (or Resulting as Annie Duke termed it in Thinking in Bets). Humans possess an innate tendency to judge the quality of a past decision entirely by its eventual outcome, rather than evaluating the soundness of the decision-making process at the moment it was made.

Figure 2: Outcome bias leads the human mind to be hijacked by short-term results rather than adhering to disciplined process.
Consider someone who drives home intoxicated, speeding through red lights at midnight, yet arrives safely without an accident. Was that a wise decision? Absolutely not. Survival was sheer chance, while the underlying behavior carries extreme mortality risk when repeated over time.
Yet in financial markets, millions engage in the same behavior: entering without clear technical rationale, neglecting position sizing, ignoring stop losses, and assuming themselves to be geniuses when lucky outcomes occur. Nassim Nicholas Taleb in Fooled by Randomness calls these individuals "Lucky Fools" — people walking through a minefield under the illusion of a leisurely garden stroll.
3. Anatomy of the 4-Quadrant Trade Classification Matrix
To shatter the illusion of Outcome Bias, GEM Frequency quantitative methodology utilizes the 4-Quadrant Trade Execution Matrix. It separates every trade along two independent axes:
- Horizontal Axis (Decision Process): Strict System Discipline vs Impulsive/Sloppy Execution.
- Vertical Axis (Financial Outcome): Profit (Win) vs Loss.
| Quadrant | Execution Behavior | Outcome | Strategic Impact & Long-Term Meaning |
|---|---|---|---|
|
Q1: Disciplined Win (Good Win) |
System setup verified, R:R $\ge 1:2$, risk fixed at 1%, structural SL/TP executed. | PROFIT | Deserved reward. Reinforces confidence in the system and fuels compounding growth. |
|
Q2: Disciplined Loss (Good Loss) |
100% adherence to plan, hit predetermined technical stop loss, zero manual interference. | LOSS | Standard cost of doing business in a probabilistic game. Preserves 99% of capital for the next edge. |
|
Q3: Sloppy Loss (Bad Loss) |
FOMO chase, no confirmation signal, oversized 2-5%+ risk, no stop loss. | LOSS | Direct market punishment. A painful yet clear wake-up call to repair psychological leaks. |
|
Q4: Sloppy Win (Bad Win) |
Reckless entry, holding drawdowns overnight, martingale averaging, won purely by random luck. | PROFIT | THE DEADLIEST TRAP. Dopamine hijacks neural reward pathways, reinforcing suicidal habits that lead to total ruin. |
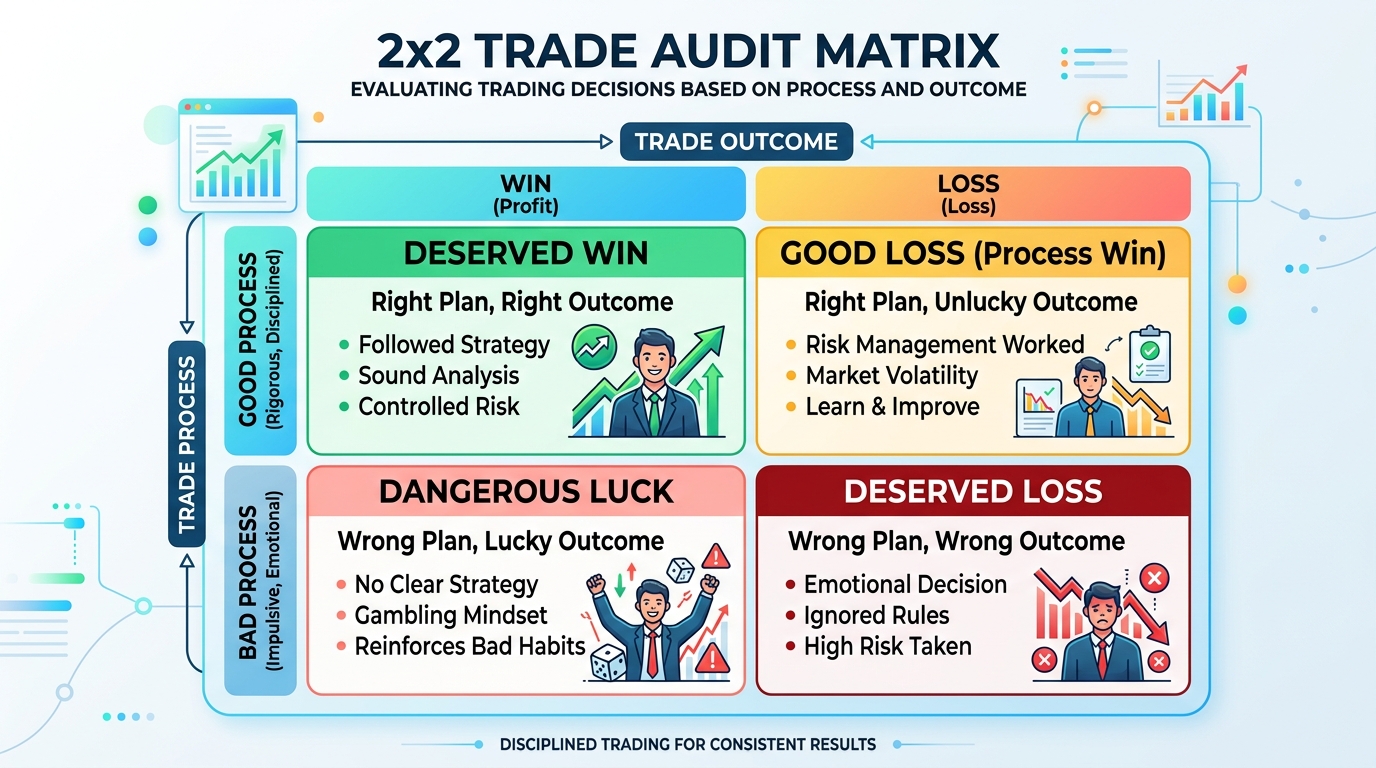
Figure 3: Visual architecture of the 4-quadrant matrix differentiating random luck from disciplined competence.
4. Quadrant 4: The Poisoned Candy of Sloppy Wins
Why do we emphasize that Quadrant 4 (Bad Wins) is exponentially more dangerous than taking a stop loss in Quadrant 3?
When you take a sloppy trade and lose (Quadrant 3), your brain receives an unambiguous negative feedback signal: financial pain. This acts as a biological defense mechanism, alerting you that the behavior was defective and must be rectified.
Conversely, when you execute recklessly and the market rewards you with a massive windfall (Quadrant 4), your brain's dopaminergic reward pathway is hijacked. This creates a toxic cognitive reinforcement loop:
You believe you have an extraordinary gift for reading the market without needing risk controls.
You tell yourself: "Last time it dipped heavily and bounced back into huge profit; why waste money on stop losses?".
Inflated confidence compels you to scale leverage 5x to 10x higher on subsequent setups.
Financial markets are infinitely patient probabilistic machines. They will gladly let you win 9 consecutive times from sloppy trades, only to bait you into betting your entire net worth on the 10th — where a single black swan move wipes out everything.
5. Quadrant 2: The Art of Accepting Operating Costs (Disciplined Losses)
True trader maturity begins when one genuinely embraces and appreciates Quadrant 2 (Good Losses).
In traditional business — whether running a cafe, manufacturing plant, or retail store — you routinely pay operating expenses: rent, utilities, machine maintenance, and payroll. No competent owner panics when paying the monthly electricity bill; it is simply the required operating cost to generate far greater net revenue.
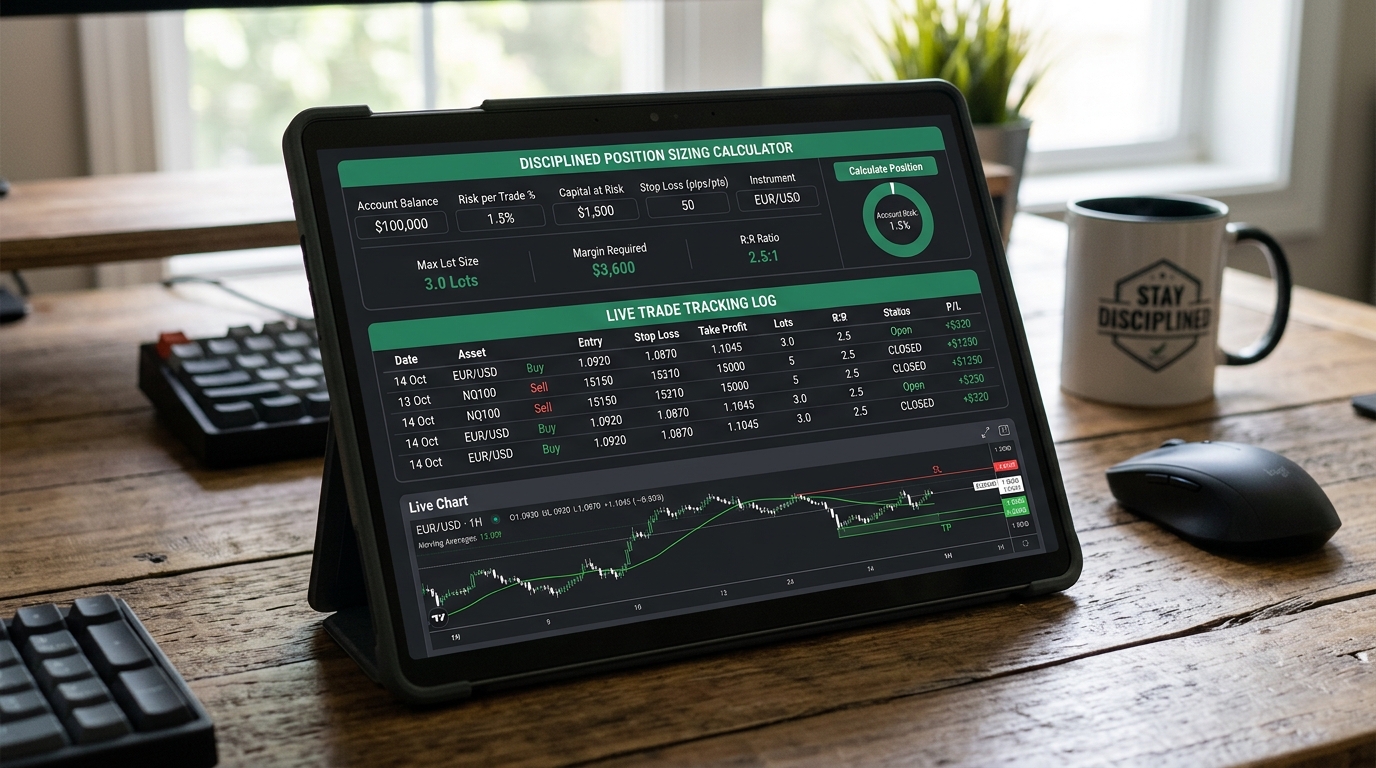
Figure 4: 1% fixed risk management transforms each loss into a fully controllable operating expense.
In trading, your Stop Loss is your electricity bill. Mark Douglas in Trading in the Zone proved this immutable truth: even with an elite 60% win-rate system, across any 100 trades, 40 losses will occur in completely unpredictable distribution.
When you take a trade on a valid setup, risk a fixed 1%, and price hits your technical stop loss, you did not fail. You executed a perfect Quadrant 2 trade. You paid 1% to protect 99% of your capital, remaining perfectly composed for the next winning run.
6. Elevating Discipline with GEM Scanner Quantitative Technology
How can a trader systematically migrate all activity out of the danger zone (Q3 & Q4) and lock 100% of decisions into the safe zone (Q1 & Q2)?
Human willpower is finite and degrades rapidly after hours of staring at price action. The sustainable solution is automating market scanning to eliminate emotional interference.
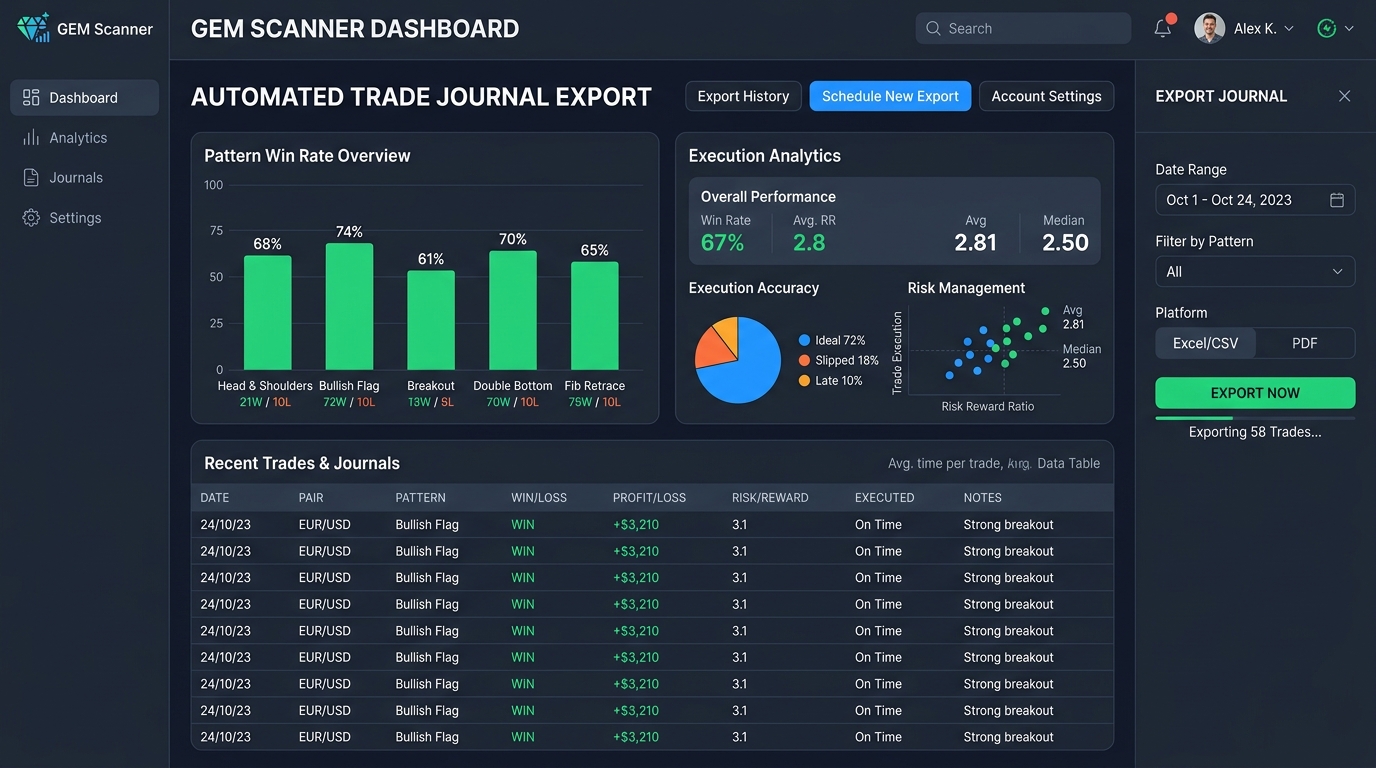
Figure 5: GEM Scanner Dashboard automatically identifies institutional order flow structures and Fresh Zones.
- Zero Speculative Guesswork: Continuous automated scanning across 150+ trading pairs, surfacing only setups meeting strict Harmonic and Fresh Zone criteria.
- Quantitative Confidence Score: Objective scoring from 0 to 100%, allowing traders to filter only high-conviction setups above 75%.
- Automated Structural R:R Calculation: Pre-calculated entry, structural invalidation stop loss, and tiered take profit targets with R:R $\ge 1:2.0$.
7. The 4-Step Self-Audit Protocol & DER Index
Apply the 4-Step Self-Audit Protocol at the end of each session:
Log Pre-Trade Parameters
Capture the GEM Scanner setup screenshot, entry reason, trigger price, structural invalidation stop loss, and 1% risk position size.
Audit Execution Behavior on Close
Answer 3 honest questions: Did you widen your stop loss? Did you panic-close before target? Did you unplanned-average down?
Assign to the 4-Quadrant Matrix
Tag the trade: Q1 (Good Win), Q2 (Good Loss), Q3 (Bad Loss), or Q4 (Bad Win). If Q4, log a warning review instead of celebrating profit.
Compute the Discipline Execution Ratio (DER)
Every weekend, calculate your quantitative Discipline Execution Ratio:
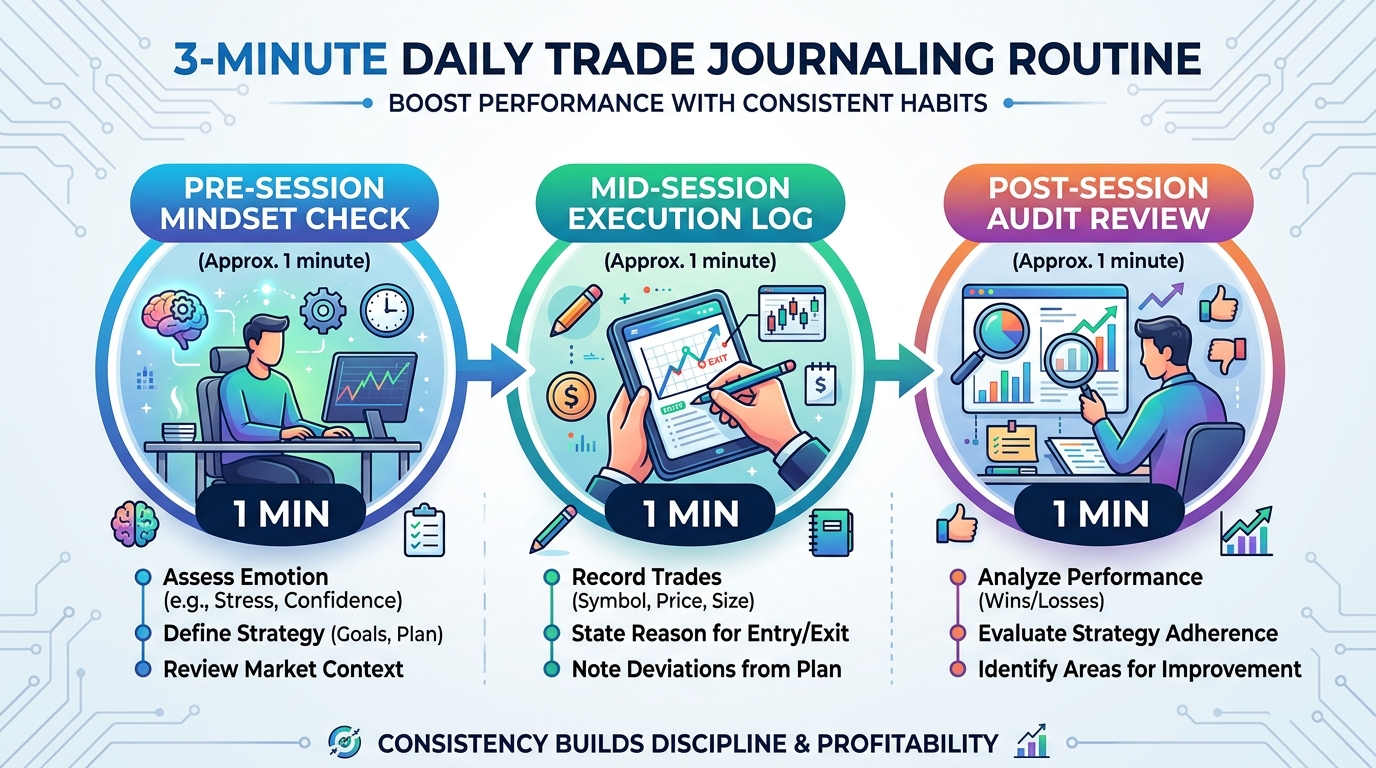
Figure 6: 3 minutes of daily journaling closes the loop on becoming a consistently disciplined trader.
8. Conclusion: Cultivating the Identity of a Consistent Trader
In financial markets, single trade outcomes always contain probabilistic randomness. You cannot control what the next candle does, but you have absolute sovereignty over your own process.
When you stop judging your worth by momentary PnL and focus on mastering the 4 quadrants and elevating your DER index, you ascend to elite consistency. You cease to be an emotional gambler and become a systematic, unshakeable investor.
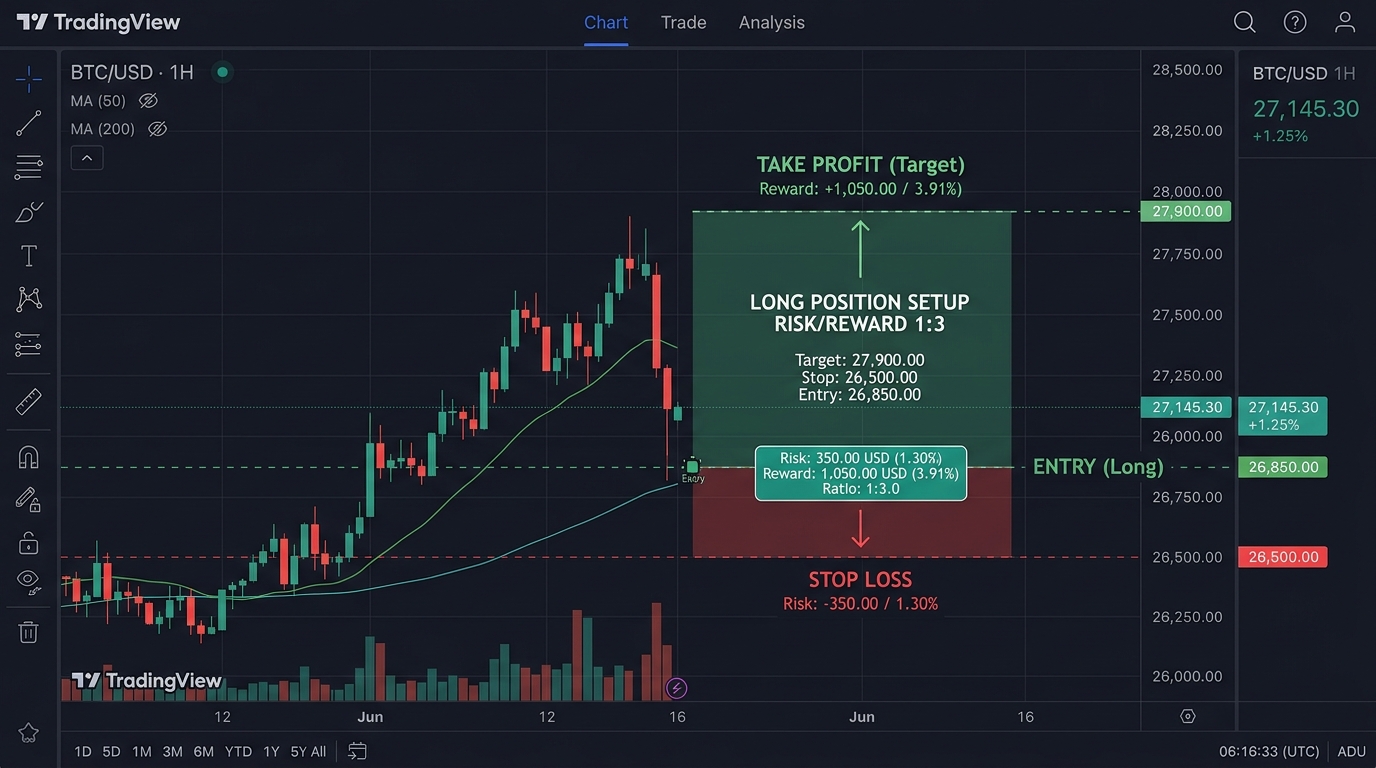
Figure 7: Technical precision paired with mental equanimity is the ultimate formula for long-term compound success.

Jennie Uyen Chu
Founder of GEMRAL • Quantitative Analyst & Creator of GEM Frequency Methodology
Jennie Uyen Chu is a professional market analyst and creator of the GEM Frequency quantitative framework. She has empowered thousands of traders worldwide to replace emotional guesswork with mathematical rigor and systematic discipline.