False Breakout: Unmasking Liquidity Traps & Stop Hunts
False Breakout: Unmasking Liquidity Traps & Smart Money Stop-Hunting Mechanisms
Why are 80% of massive bullish breakout candles actually the beginning of severe account drawdowns? Discover order book microstructure, crowd psychology, and how financial institutions trap retail liquidity.
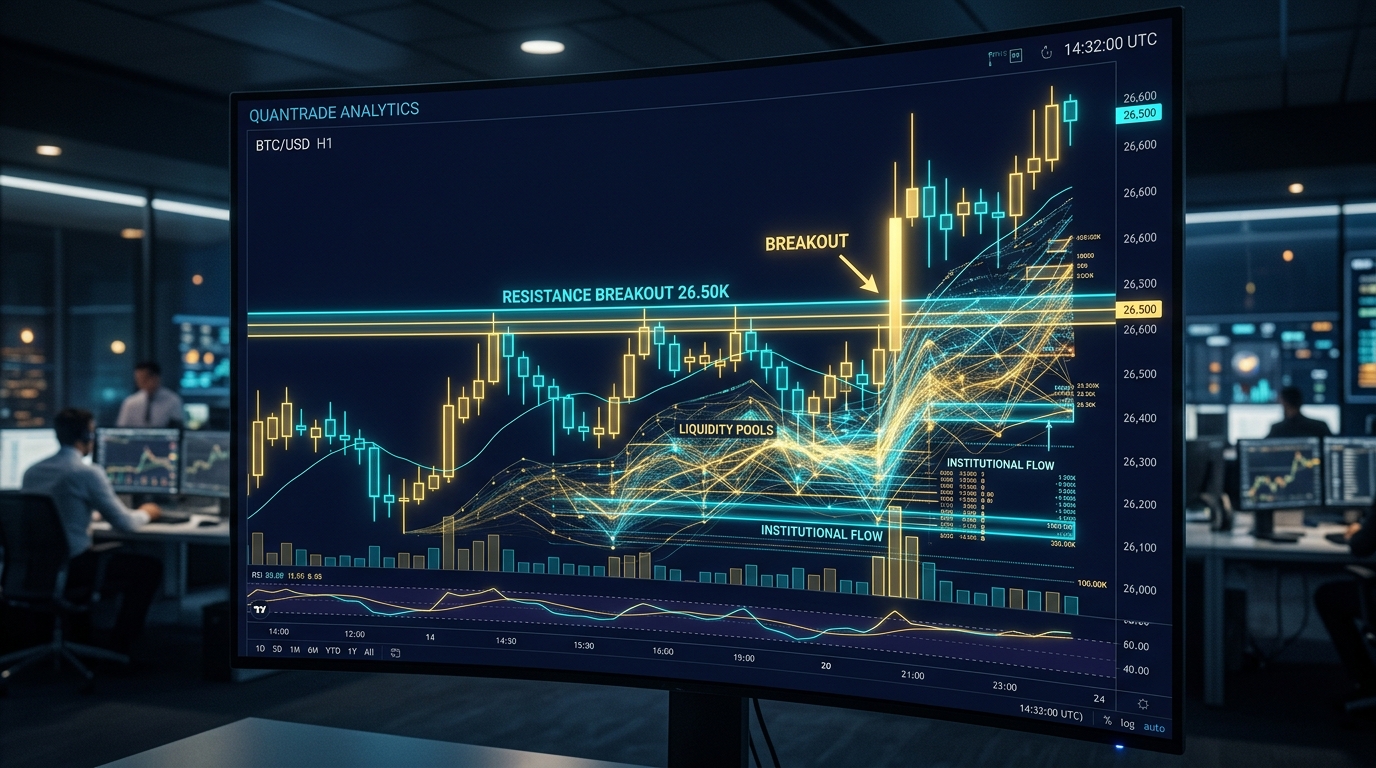
Figure 1: Behind glowing breakout candles often lies a stop-loss liquidity net engineered by institutional smart money.
Table of Contents
01. The Breakout Buyer's Nightmare: When the Best-Looking Candle Is the Most Dangerous
Be honest with yourself: How many times have you sat patiently watching an asset consolidate sideways for weeks in sheer boredom? You promised yourself not to trade impulsively. Then suddenly, a massive green Marubozu candle emerges, ripping through a major resistance level while social media groups erupt with aggressive price targets.
Dopamine surges through your brain. Fear of Missing Out (FOMO) completely overwhelms your discipline. You press the Market Buy button with absolute conviction that a massive bullish wave has officially begun.
Yet just hours after your order fills at the absolute peak, the vibrant green candle leaves a long upper wick. A colossal red candle crashes down, engulfing the entire rally. Price plummets relentlessly, slicing through the nearest swing low and wiping out your stop loss. The feeling isn't just financial loss; it's sheer frustration: "Why does the market always wait until the exact moment I buy to reverse?"
02. Order Book Microstructure: Why Institutions Need You Buying the Top
To stop being a victim, you must view the market through the lens of institutional Market Makers and Smart Money. Large institutional capital does not trade thousands of dollars; they manage hundreds of millions or billions. With such immense capital size, their paramount operational constraint is Liquidity Matching.
If a hedge fund wants to offload $50M worth of an asset at the top, they cannot dump market sell orders into quiet trading. Doing so would cause severe slippage, crashing the price and forcing them to sell at steep discounts. They require an enormous pool of willing buyers to absorb that $50M at peak prices.
Where is the largest cluster of eager buyers concentrated? Precisely above prior swing highs and major resistance. This zone harbors two massive streams of buy liquidity:
- Short Seller Stop-Loss Orders (Buy Stops): Traders holding short positions place stop losses above resistance. When triggered, their stops execute automatically as market BUY orders.
- Retail Breakout Buy Orders (Buy Stops / Market Buys): Conventional breakout traders place pending orders or manually buy as soon as price breaches resistance.
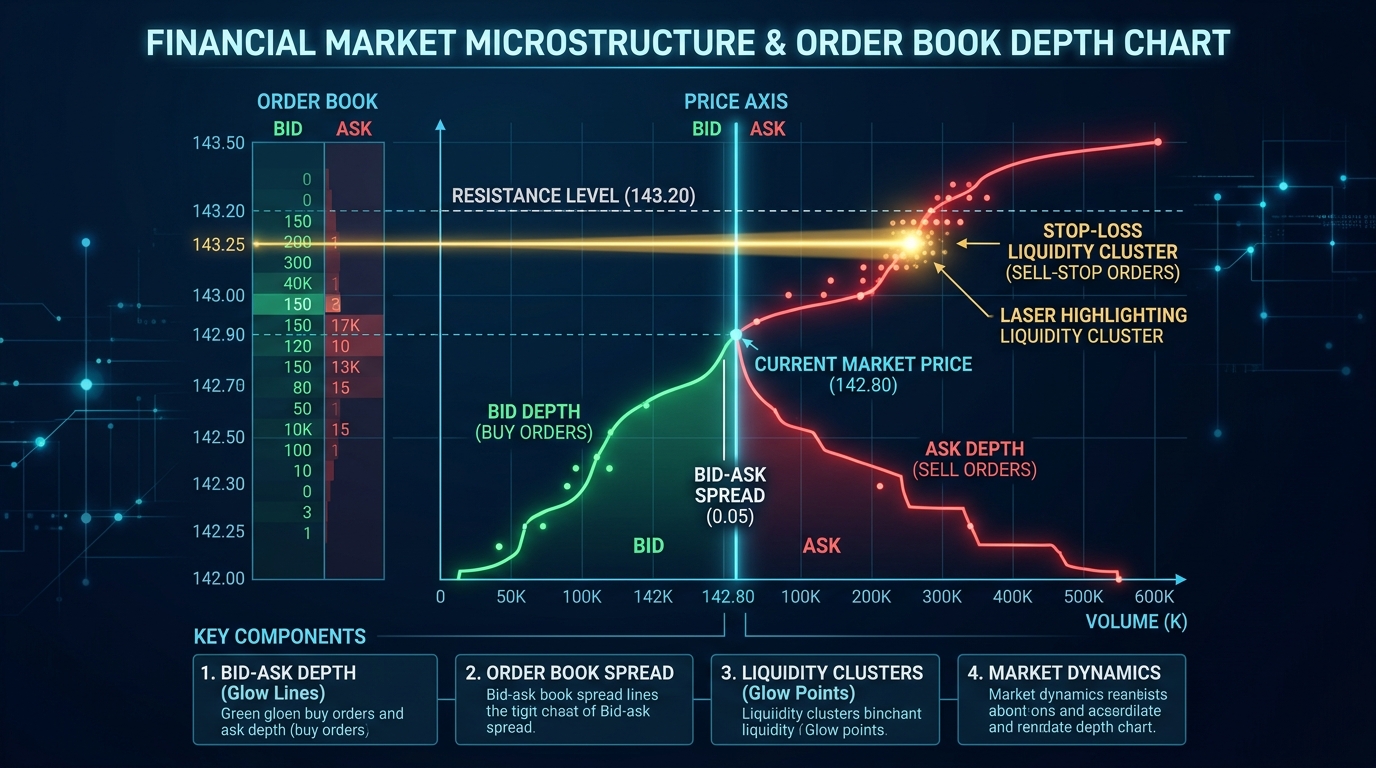
Figure 2: Order book depth flow — Institutions trigger buy stops to distribute short inventory at optimal prices.
By deploying a small amount of seed capital to nudge price slightly above resistance, smart money triggers a cascade of retail market BUY orders. In that brief window, they fill massive opposing SELL limit orders into that liquidity. Once retail buying power is fully absorbed, demand evaporates and price collapses. The false breakout trap snaps shut.
03. Identifying 3 Classic False Breakout Traps in the Market
Despite endless variations, almost all liquidity traps throughout market history follow these 3 core anatomical patterns:
Pattern 1: The Swing Failure Pattern (SFP) Liquidity Sweep
The Swing Failure Pattern (SFP) occurs when price deliberately pokes above a prior swing high but fails to close above it. The candle leaves a prominent upper wick and closes firmly back inside the previous range.
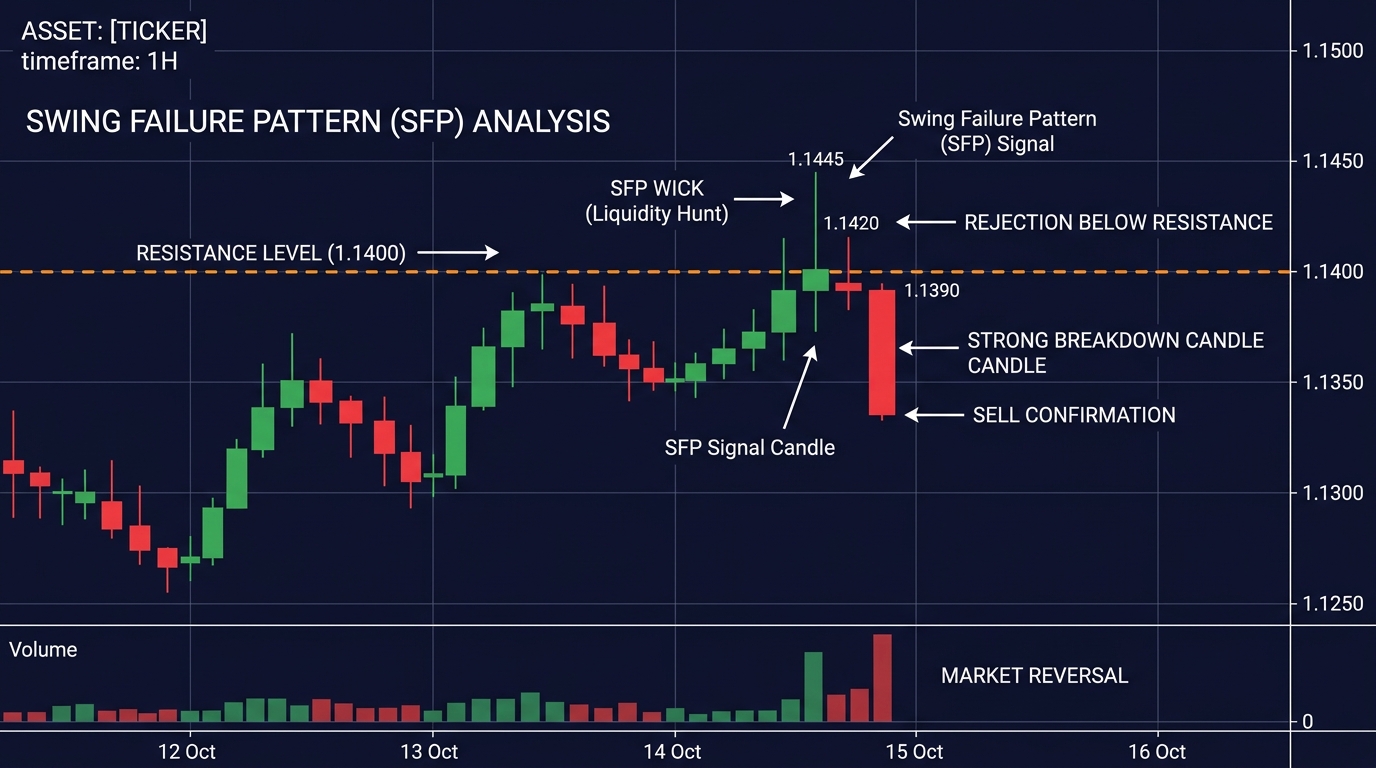
Figure 3: Swing Failure Pattern structure — Sweeping liquidity wicks closing back below resistance indicate strong reversals.
Microstructure Insight: The wick extension exists solely to sweep stop-loss clusters. A close back inside the consolidation range confirms buyer exhaustion and total seller dominance.
Pattern 2: The Victor Sperandeo 2B Reversal Pattern
Introduced by legendary Wall Street trader Victor Sperandeo (Trader Vic), the 2B rule describes a setup where price breaks a prior high, hovers for 1 to 3 small candles without continuation momentum, and then violently closes back below the previous high.
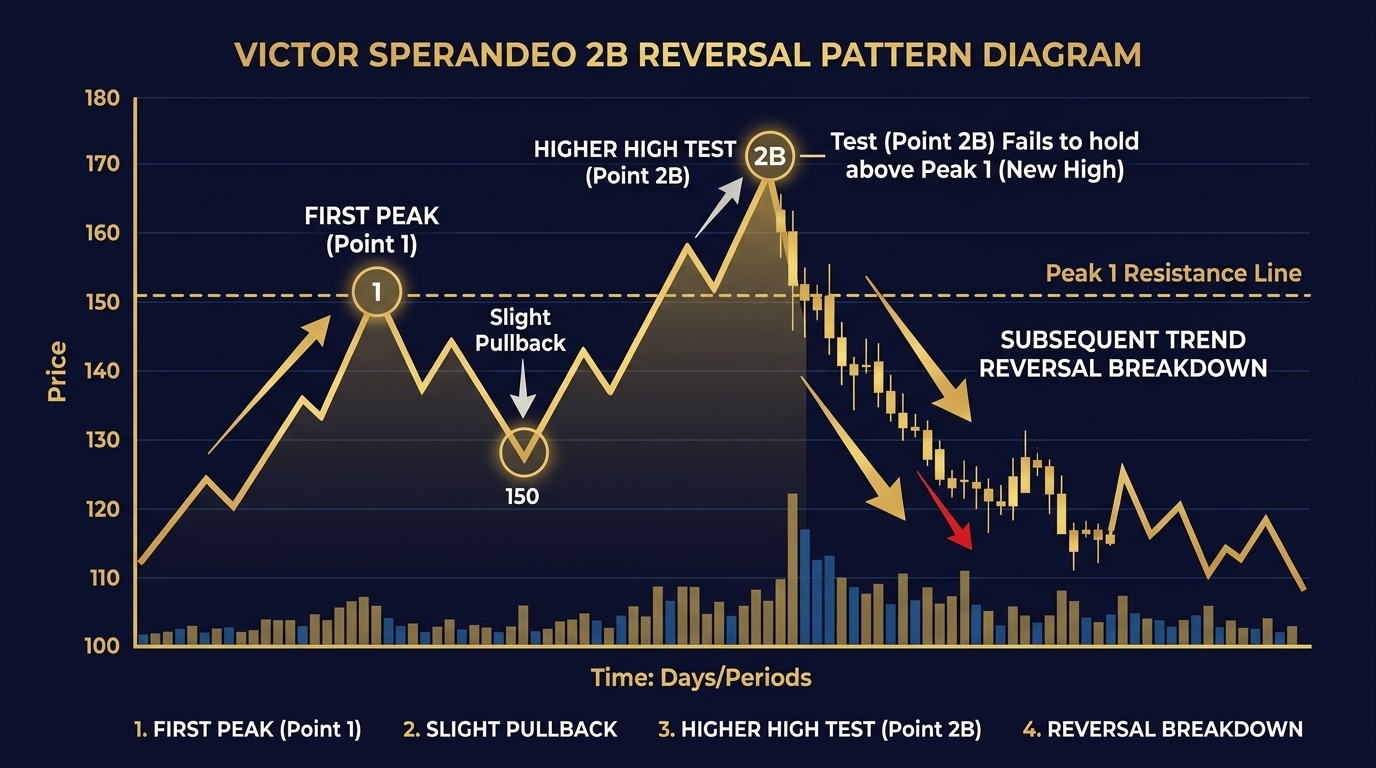
Figure 4: 2B Reversal Pattern — When upside momentum falters after a breakout, the ensuing breakdown occurs at triple velocity.
Practical Lesson: When price breaks out but subsequent candles show tiny bodies, low volume, and indecision, it signals a severe Lack of Follow-through. Never stubbornly hold long positions under these conditions.
Pattern 3: Wyckoff Upthrust After Distribution (UTAD)
In Richard Wyckoff's classic methodology, the UTAD (Upthrust After Distribution) is the climax of the distribution phase. After an extended consolidation range, price is aggressively pushed above resistance to instill absolute retail conviction in a multi-year bull run.
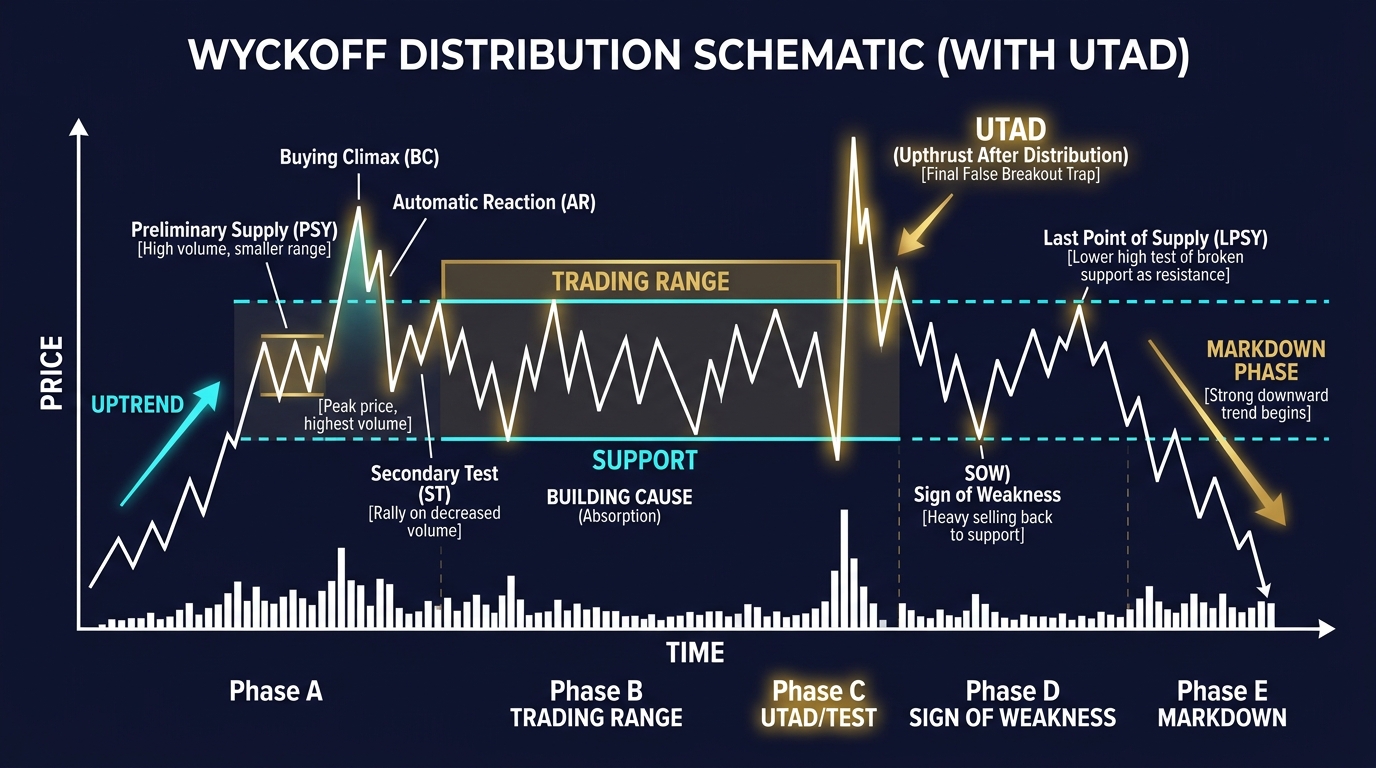
Figure 5: Wyckoff Distribution — The UTAD upthrust liquidates residual inventory before the markdown phase begins.
Warning Sign: Trading volume during the UTAD surges dramatically, yet the price progress is remarkably narrow relative to the effort (Effort vs. Result asymmetry). This is irrefutable evidence of covert institutional distribution.
04. The 4-Layer Filter: An Actionable Defensive System Against Liquidity Traps
How can you distinguish a genuine trend-starting breakout from a lethal liquidity trap? Strictly apply this proprietary 4-layer filter from the GEM Frequency Method:
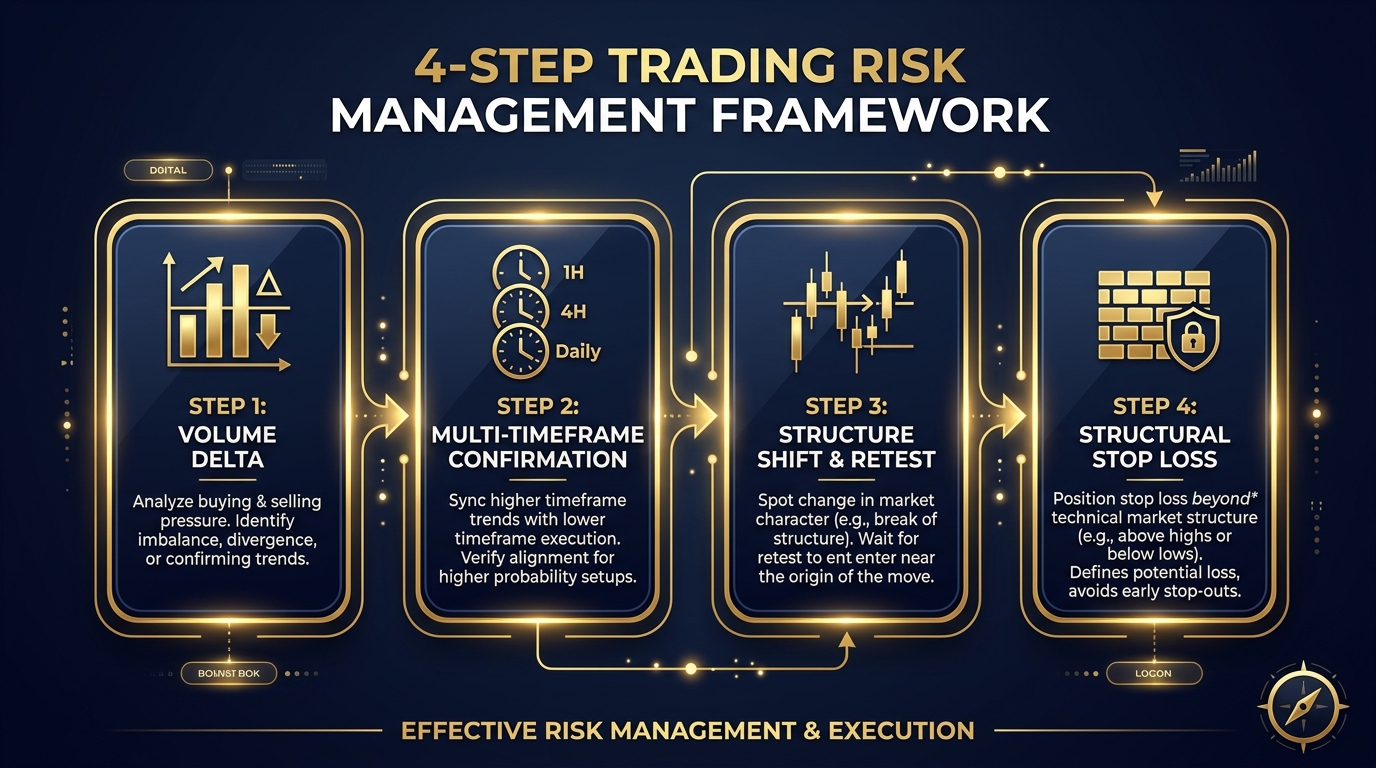
Figure 6: 4-step defensive framework — From volume delta and multi-timeframe alignment to structural stop losses.
A genuine breakout requires an explosive surge in net buying volume (Positive Cumulative Delta). If price breaks resistance on volume below the 20-period average, or exhibits bearish RSI/MACD divergence, treat it as a trap until proven otherwise.
Never trade a breakout based solely on 5-minute or 15-minute charts when Daily (D1) or 4-Hour (H4) timeframes are testing major macro resistance. Higher timeframe bias always crushes lower timeframe noise.
Never buy an unclosed candle. Patiently wait for candle close confirmation above resistance, then observe the retest. The retest must exhibit narrow-range candles and depleted volume (exhaustion zones).
Stop losses must never be placed arbitrarily based on dollar amounts (e.g., -$20 or -1%). They must sit behind valid structural invalidation levels — the exact level where your trading thesis is formally invalidated.
05. AI Algorithms & GEM Scanner: Automating Candlestick Trap Detection
In live markets, liquidity sweeps unfold in seconds to minutes. Under rapid volatility, human emotions easily freeze, causing erratic mistakes. Transitioning to algorithmic quantitative screening is the natural evolution of professional traders.
The GEM Scanner system is trained on over a decade of price action and liquidity microstructure. Rather than subjective guesswork, the tool executes 3 core tasks automatically:
- Liquidity Heatmap Mapping: Accurately visualizes buy and sell stop-loss clusters so you never position orders where stop hunts occur.
- Exhaustion Candle Alerts: Instantly detects anomalous volume candles lacking price velocity, flagging real-time SFP and 2B traps.
- Smart Risk-Reward (R:R) Calculation: Calculates structural invalidation points and recommends a minimum 1:2.5 R:R setup before trade entry.
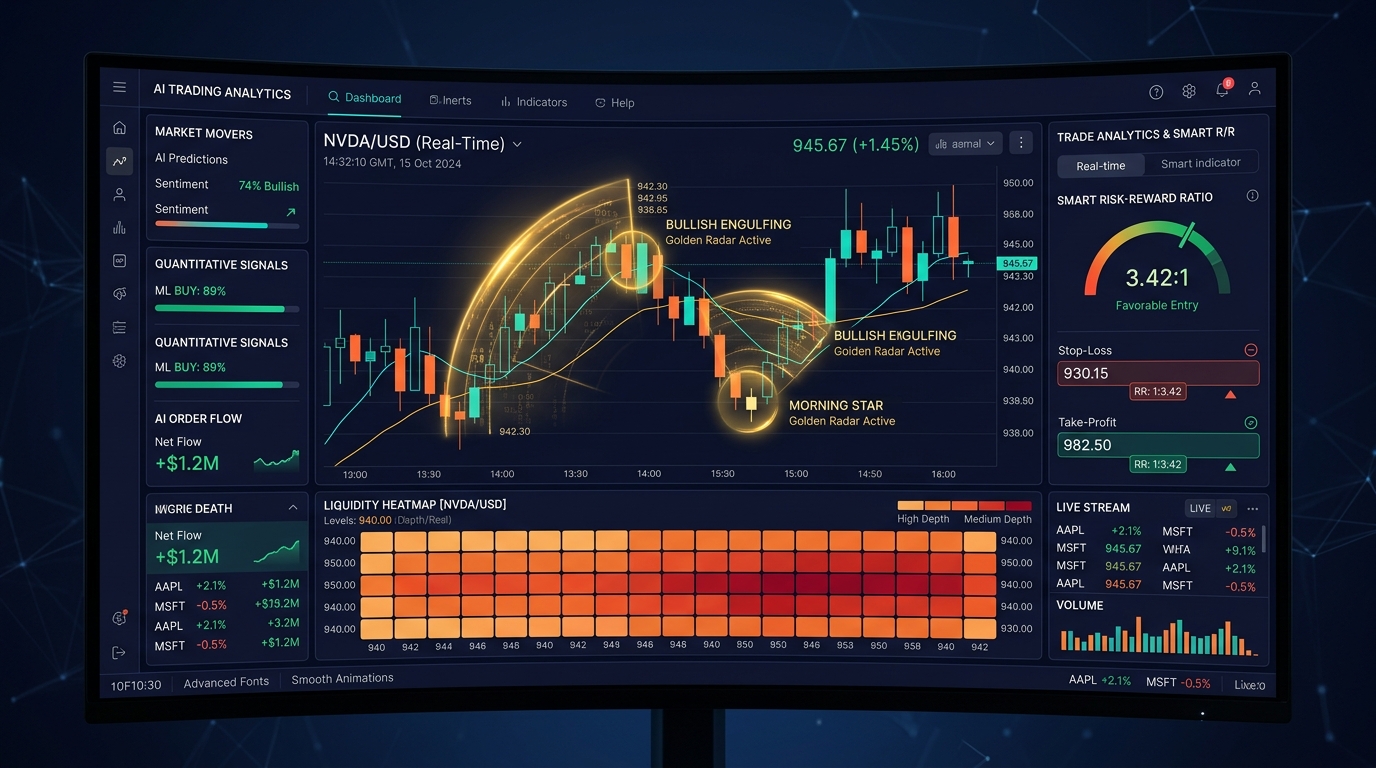
Figure 7: GEM Scanner visualizes liquidity clusters and identifies breakout traps, eliminating subjective emotional bias.
06. Robert Greene's Law 33: Crowd Psychology & Unwavering Discipline
In the seminal work The 48 Laws of Power, Robert Greene outlines in Law 33: Discover Each Man's Thumbscrew. Human vulnerability stems from greed, impatience, and intense FOMO when seeing others generate immediate returns.
Market makers understand this deeply. They do not need force; they simply paint a vibrant breakout candle and let greed guide you straight into their trap.
"The true masters in financial markets are those who wait patiently in stillness, watching the crowd succumb to emotional traps, before stepping in calmly to harvest results."
The frequency of a master trader is one of quiet objectivity. When you cease trading on emotional excitement and begin reading liquidity structure, you stop being prey for false breakouts.
07. Key Takeaways & Your Transformation Journey
5 Immutable Principles to Remember:
- Liquidity is Market Lifeblood: Above prior highs lie stop-loss buy clusters engineered to facilitate institutional distribution.
- Never Buy Unclosed Candles: Always wait for candle close confirmation and verify the retest on depleted volume.
- Master the 3 Core Traps: The SFP wick sweep, the Sperandeo 2B reversal, and the Wyckoff UTAD distribution trap.
- 4-Layer Defense Filter: Analyze Volume Delta, align multi-timeframe trends, wait for MSS, and anchor stops to structural invalidation.
- Leverage Objective Quantitative Tools: Let data and algorithms shield your capital from impulsive psychological reactions.
Founder of the Gemral ecosystem, specialist in financial market microstructure and the GEM Frequency trading methodology. With over 8 years of global market experience, Jennie transforms behavioral psychology and probability mathematics into sustainable investment solutions for the community.
Select Your Ideal Tools & Solutions
Build an objective trading system, eliminate 100% emotional interference, and safeguard your capital against market traps.

Starter Trading Course
Master technical analysis foundations, 4 core frequency patterns, professional risk management, and eliminate the 4 psychological traps that eliminate 95% of beginners.

GEM Scanner PRO (1 Year)
Automatically scans and detects 24 frequency patterns, pre-calculating R:R ratios, entries, stop losses, and take profits objectively without emotional bias.

Golden Crystal Pillar (Super Citrine)
Premium natural citrine crystal activating the Solar Plexus chakra, enhancing mental clarity, decisive focus, and sustainable wealth attraction.
References & Academic Literature (24 Sources)
- Sperandeo, V. (1991). Trader Vic: Methods of a Wall Street Master. John Wiley & Sons.
- Wyckoff, R. D. (1931). The Richard D. Wyckoff Method of Trading and Investing in Stocks. Section 9: Distribution and Upthrust.
- Harris, L. (2003). Trading and Exchanges: Market Microstructure for Practitioners. Oxford University Press.
- O'Hara, M. (1995). Market Microstructure Theory. Blackwell Publishers.
- Biais, B., Foucault, T., & Moinas, S. (2015). Equilibrium Fast Trading. Journal of Financial Economics, 116(2), 292-313.
- Hasbrouck, J. (2007). Empirical Market Microstructure: The Institutions, Economics, and Econometrics of Securities Trading. Oxford University Press.
- Douglas, M. (2000). Trading in the Zone: Master the Market with Confidence, Discipline and a Winning Attitude. New York Institute of Finance.
- Bulkowski, T. N. (2021). Encyclopedia of Chart Patterns (3rd Edition). John Wiley & Sons.
- Kahneman, D., & Tversky, A. (1979). Prospect Theory: An Analysis of Decision under Risk. Econometrica, 47(2), 263-291.
- Lo, A. W., & MacKinlay, A. C. (1999). A Non-Random Walk Down Wall Street. Princeton University Press.
- Steenbarger, B. N. (2006). Enhancing Trader Performance: Proven Strategies from the Cutting Edge of Trading Psychology. Wiley.
- Greene, R. (1998). The 48 Laws of Power (Law 33: Discover Each Man's Thumbscrew). Viking Press.
- Greene, R. (2018). The Laws of Human Nature. Viking.
- Taleb, N. N. (2004). Fooled by Randomness: The Hidden Role of Chance in Life and in the Markets. Random House.
- Menkveld, A. J. (2013). High frequency trading and the new market makers. Journal of Financial Markets, 16(4), 712-740.
- Cartea, A., Jaimungal, S., & Penalva, J. (2015). Algorithmic and High-Frequency Trading. Cambridge University Press.
- Cont, R., & de Larrard, A. (2013). Price dynamics in a Markovian limit order book. SIAM Journal on Financial Mathematics, 4(1), 1-25.
- Kyle, A. S. (1985). Continuous auctions and informed trader. Econometrica, 53(6), 1315-1335.
- Thaler, R. H. (2005). Advances in Behavioral Finance (Vol. II). Princeton University Press.
- Foucault, T., Pagano, M., & Roell, A. (2013). Market Liquidity: Theory, Evidence, and Policy. Oxford University Press.
- Bouchaud, J. P., Farmer, J. D., & Lillo, F. (2009). How markets slowly digest large orders. In Handbook of Financial Markets: Dynamics and Evolution (pp. 57-160). North-Holland.
- Shleifer, A., & Vishny, R. W. (1997). The Limits of Arbitrage. Journal of Finance, 52(1), 35-55.
- GEM Academy. (2026). GEM Frequency Market Microstructure & False Breakout Handbook. GEM Publishing.
- GEM Academy. (2026). GEM Frequency Market Microstructure & False Breakout Handbook. GEM Publishing.