Volume Confirmation: Beautiful Candles but Exhausted Volume—Who to Trust?
Volume Confirmation: Beautiful Candles but Exhausted Volume—Who to Trust?
A long green candlestick breaking through resistance can look like a life-changing profit opportunity, but it can also be a lethal trap engineered by institutional players. If price represents what the market says, volume is the undeniable proof of what the market is actually doing.

Figure 1: Professional analysis workspace and volume chart validating smart money flow.
TABLE OF CONTENTS
- 1. The Illusion of Naked Candlesticks & The Tragedy of Superficial Trading
- 2. Wyckoff's Law of Effort vs Result & The Essence of Volume Divergence
- 3. The 4 Price-Volume Matrix Scenarios & Decoding Whale Behavior
- 4. 5-Step Volume Breakout Validation Checklist & Core Tools
- 5. Closing Remarks from Jennie & Key Takeaways Box
- 6. Academic References & Order Flow Studies
1. The Illusion of Naked Candlesticks & The Tragedy of Superficial Trading
Imagine witnessing a sleek luxury sports car hurtling down the highway at 150 km/h. Its glamorous exterior and blinding speed command immediate admiration from onlookers. But if you knew its fuel tank was flashing empty and the engine was grinding dry from a lack of oil, would you dare step inside?
In financial markets, Japanese candlestick charts represent the speed and styling of the car, while Trading Volume is the fuel in the tank. Most retail traders are hypnotized by red and green colors and candle body sizes. Seeing an enormous green candle erupt past a resistance level, the instinctive impulse of the crowd is to chase and buy immediately.
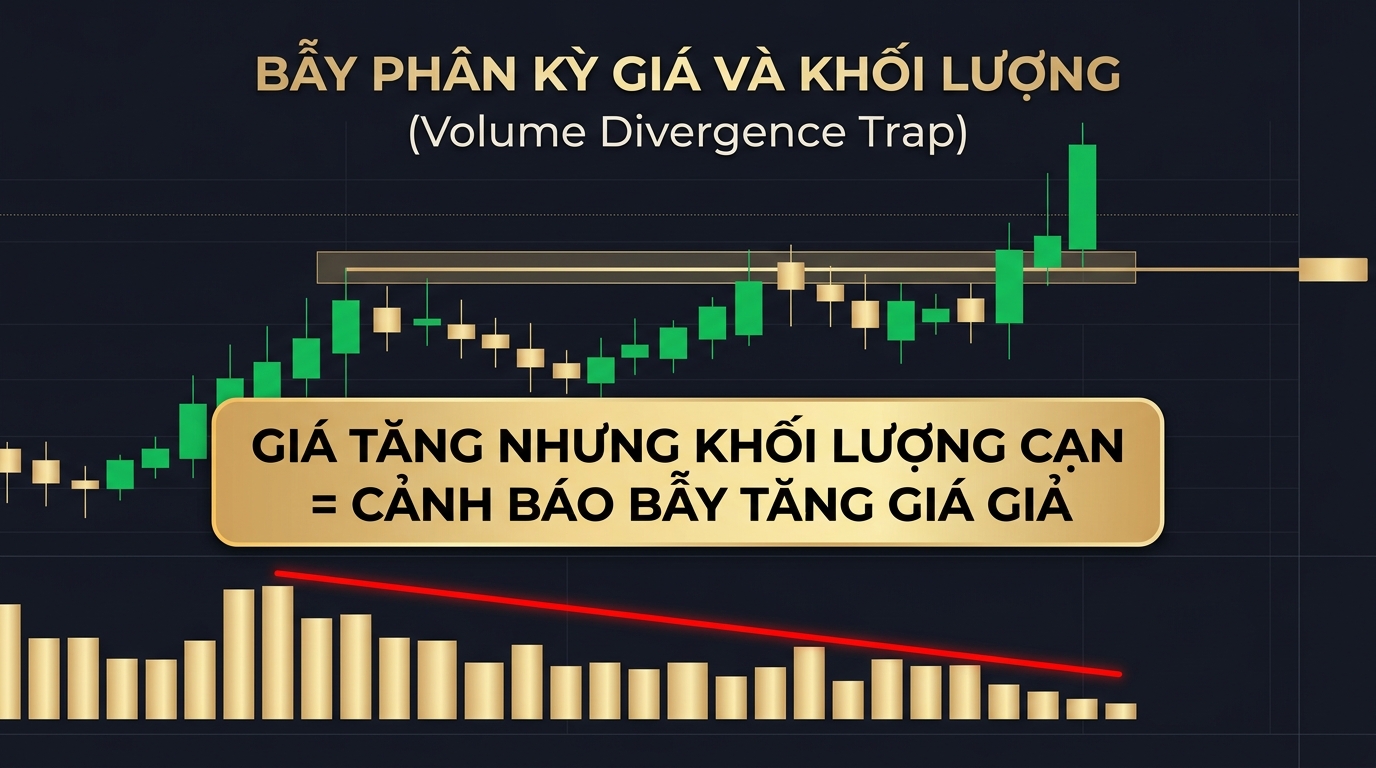
Figure 2: Price vs Volume Divergence Trap — When price rallies aggressively on exhausted volume, warning of a sudden violent reversal.
Yet, a magnificent green candle appearing without a commensurate surge in trading volume is like a supercar running on fumes. This phenomenon stems merely from a temporary vacuum of sell orders, not authentic institutional buying demand. Large operators only need a fraction of capital to push price higher, sparking retail FOMO and creating an ideal Bull Trap to offload inventory at premium prices.
"Price reflects transient sentiment and fleeting hope, but volume reveals authentic money and the balance-sheet commitment of those who control the game." — Jennie Uyen Chu
2. Wyckoff's Law of Effort vs Result & The Essence of Volume Divergence
Over a century ago, pioneering market master Richard D. Wyckoff distilled three immutable laws governing all price dynamics: The Law of Supply and Demand, The Law of Cause and Effect, and most importantly, The Law of Effort vs Result.
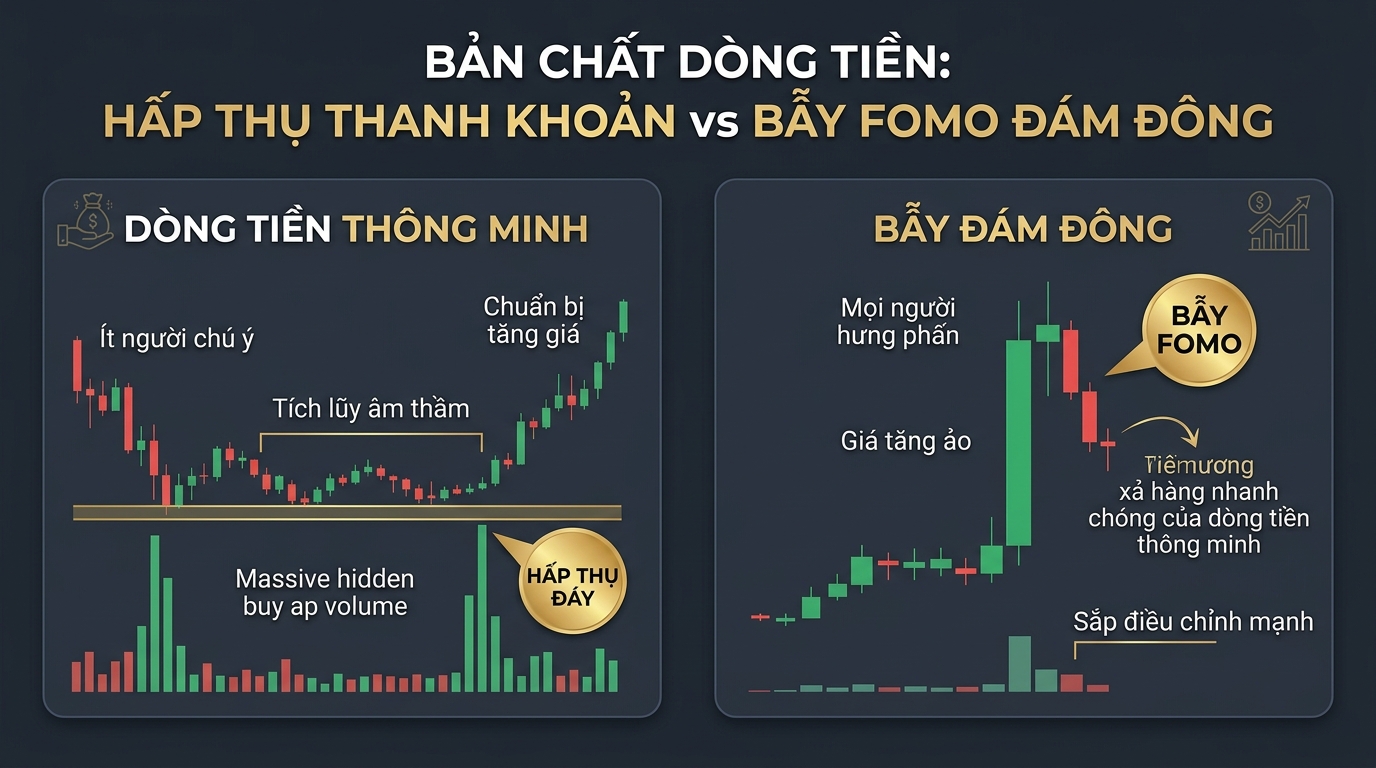
Figure 3: Smart Money quietly absorbing supply at the bottom versus the euphoric retail liquidity trap at the top.
Effort Is Measured by Volume; Result Is Expressed by Price Movement
In Volume Spread Analysis (VSA), trading volume is defined as the market participants' Effort, while the candlestick spread and price displacement constitute the Result achieved from that effort.
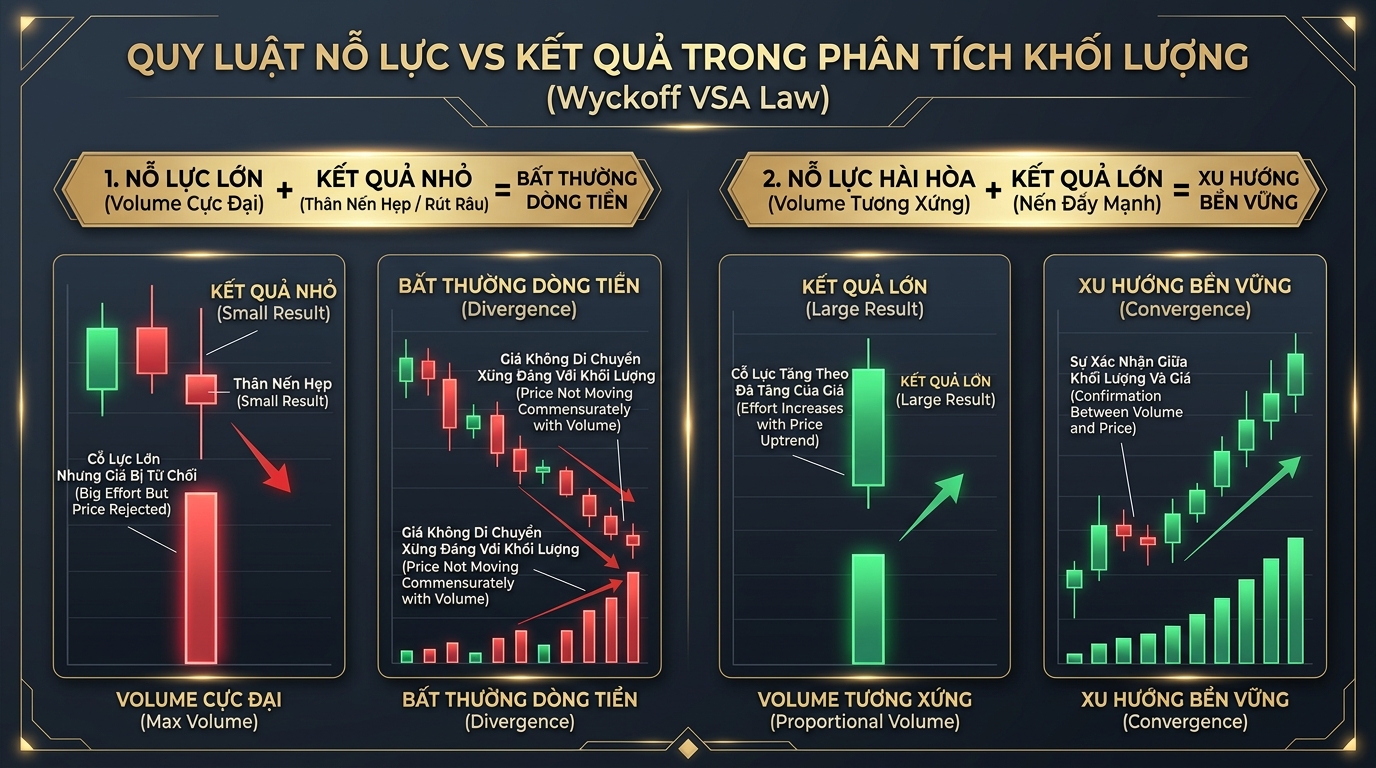
Figure 4: The two core states of Wyckoff's law — Order Flow Divergence vs Sustainable Trend Convergence.
When the relationship between Effort and Result operates harmoniously, the market is in Convergence:
- Increasing Effort → Increasing Result: Substantial volume accompanied by a wide candle body proves buyers hold complete dominance and are absorbing all opposing ask orders.
- Decreasing Effort → Decreasing Result: Low volume accompanied by narrow candles during pullbacks demonstrates an absence of selling pressure, signaling the primary trend is ready to resume.
However, when anomalies (Divergence) appear, extreme danger looms:
Anomaly Type 1: High Effort - Low Result
Trading volume explodes to record highs, yet the candle body remains remarkably narrow or prints a long upper shadow. This proves immense institutional hidden supply is selling directly into retail bids (Absorption), soaking up all crowd buying power.
Anomaly Type 2: Low Effort - High Result
The candle body surges higher and breaches highs, but volume withers below the 20-period moving average. This is undeniable proof of lack of institutional participation (Lack of Demand), leaving price vulnerable to collapse at the first wave of profit-taking.
3. The 4 Price-Volume Matrix Scenarios & Decoding Whale Behavior
To establish a rapid order flow framework during active sessions, we can synthesize market dynamics into The 4 Price & Volume Matrix Scenarios:
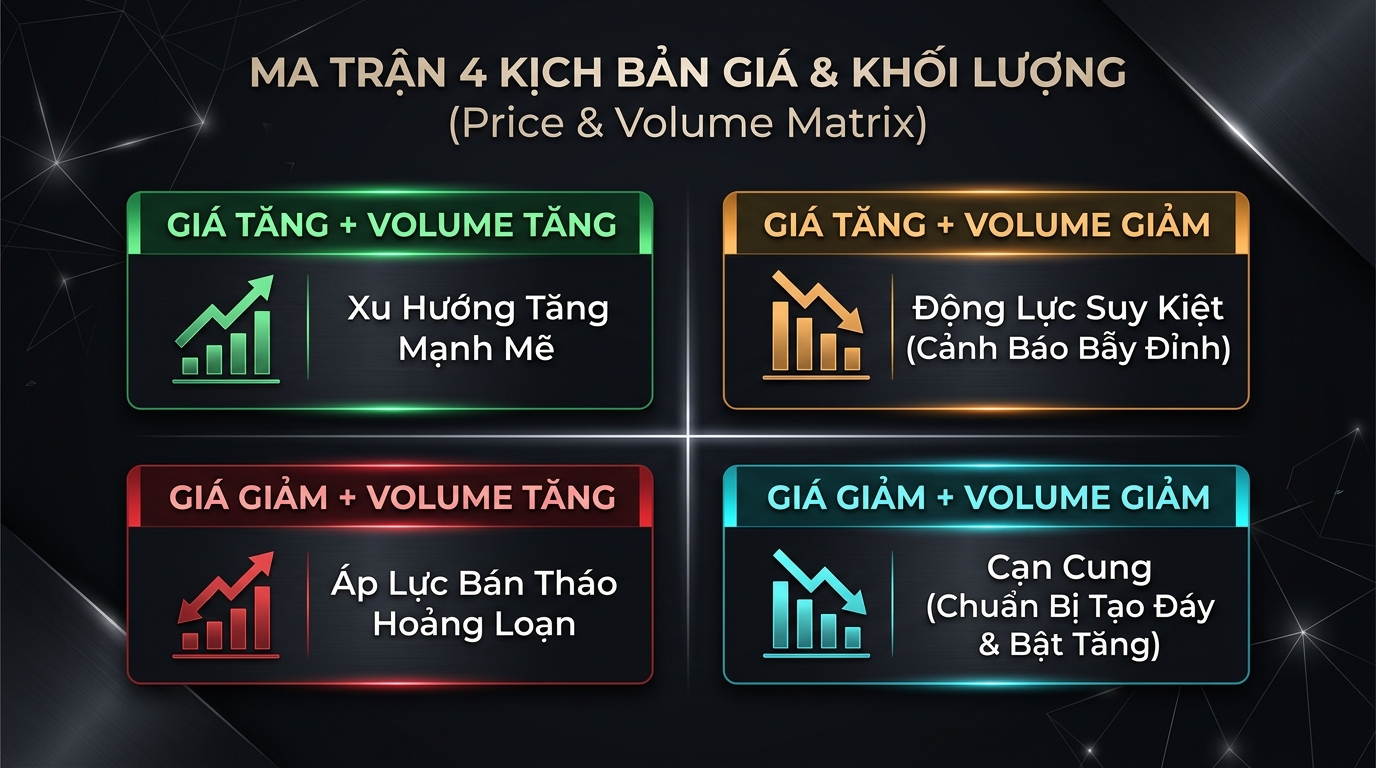
Figure 5: The 4 matrix scenarios coordinating price trajectory and trading volume validation.
Price Up + Volume Up (Robust Healthy Trend)
Authentic fresh capital is pouring into the market, buying aggressively despite rising prices. Buyers hold overwhelming control and are willing to hit higher ask prices. This is the optimal condition to hold trend positions or pyramid on shallow pullbacks.
Price Up + Volume Down (Exhausted Momentum)
Price advances solely on inertia due to a temporary lack of active sellers, while institutional buyers have stopped accumulating. This breakout frequently serves as a liquidity trap before a major distribution dump. Never chase long here.
Price Down + Volume Up (Panic Capitulation)
Aggressive, decisive liquidation from large holders coupled with cascading automated stop-losses. The market is searching for a new equilibrium; catching falling knives is strictly prohibited until absorption signatures emerge.
Price Down + Volume Down (Supply Depletion & Accumulation)
Within a macro bull trend, corrective pullbacks characterized by steadily drying volume demonstrate sellers have exhausted their inventory. This represents a prime window to look for high-probability entries upon reversal confirmation.
4. 5-Step Volume Breakout Validation Checklist & Core Tools
To avoid falling prey to sophisticated liquidity traps, every single breakout trade must satisfy the standardized 5-Step Volume Validation Protocol below:
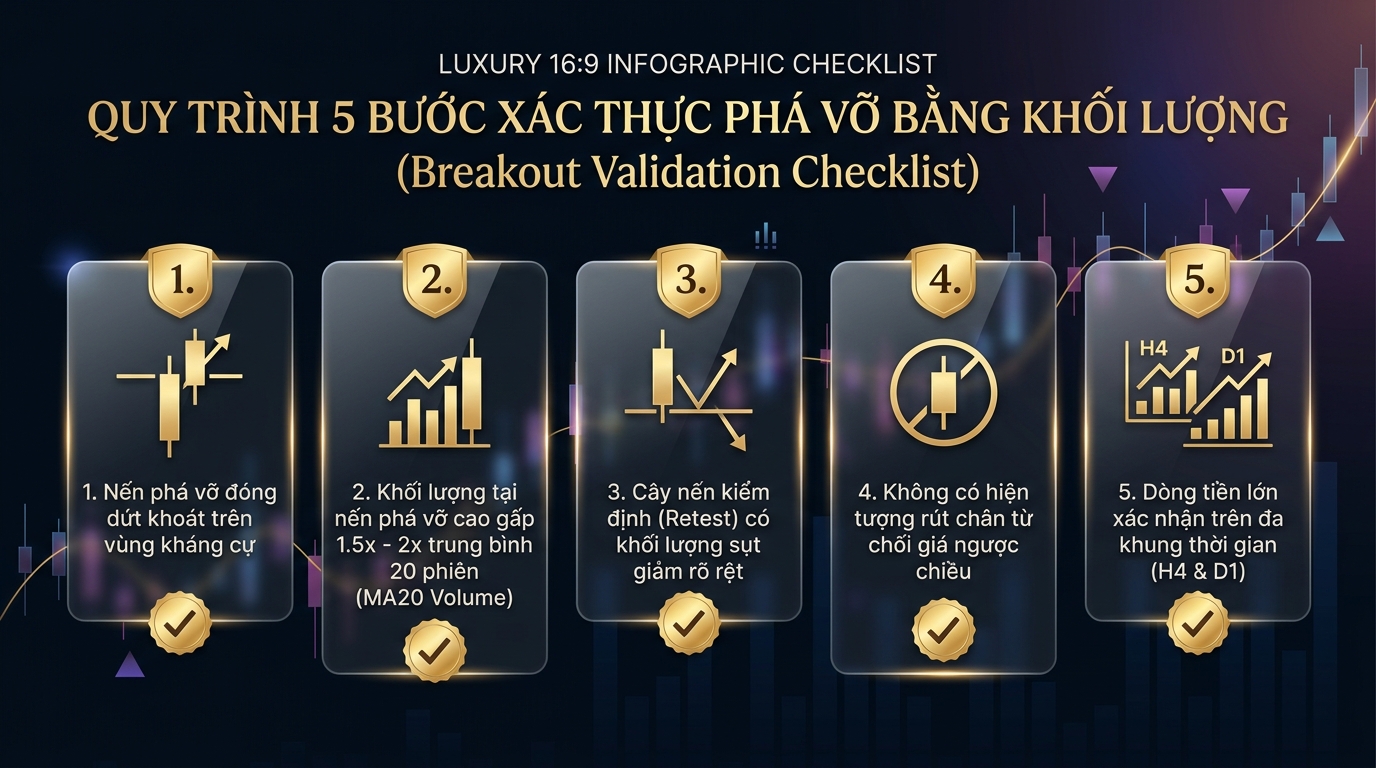
Figure 6: The 5 prerequisite conditions required before executing any breakout trade.
Decisive Candle Close Outside Resistance / Support
The breakout candle must close cleanly beyond the technical boundary, with the body comprising at least 70% of total candle length and no conflicting wick rejection.
Volume Surge 1.5x - 2x Above the 20-Period Moving Average
Volume on the breakout candle must decisively outpace the 20-period volume moving average (MA20), proving genuine institutional sponsorship.
Retest Candle Features Sharply Contracting Volume
When price retests the broken zone, testing candles must exhibit severe volume contraction, verifying opposing participants have zero remaining strength.
Cross-Referencing Volume Profile & Liquidity Nodes
Analyze High Volume Nodes (HVN) and the Point of Control (POC) to establish high-confidence profit targets and structural stop-loss invalidation zones.
Multi-Timeframe Order Flow Alignment
A 4-Hour (H4) volume breakout must align harmoniously with the macro order flow structure on the Daily (D1) chart.
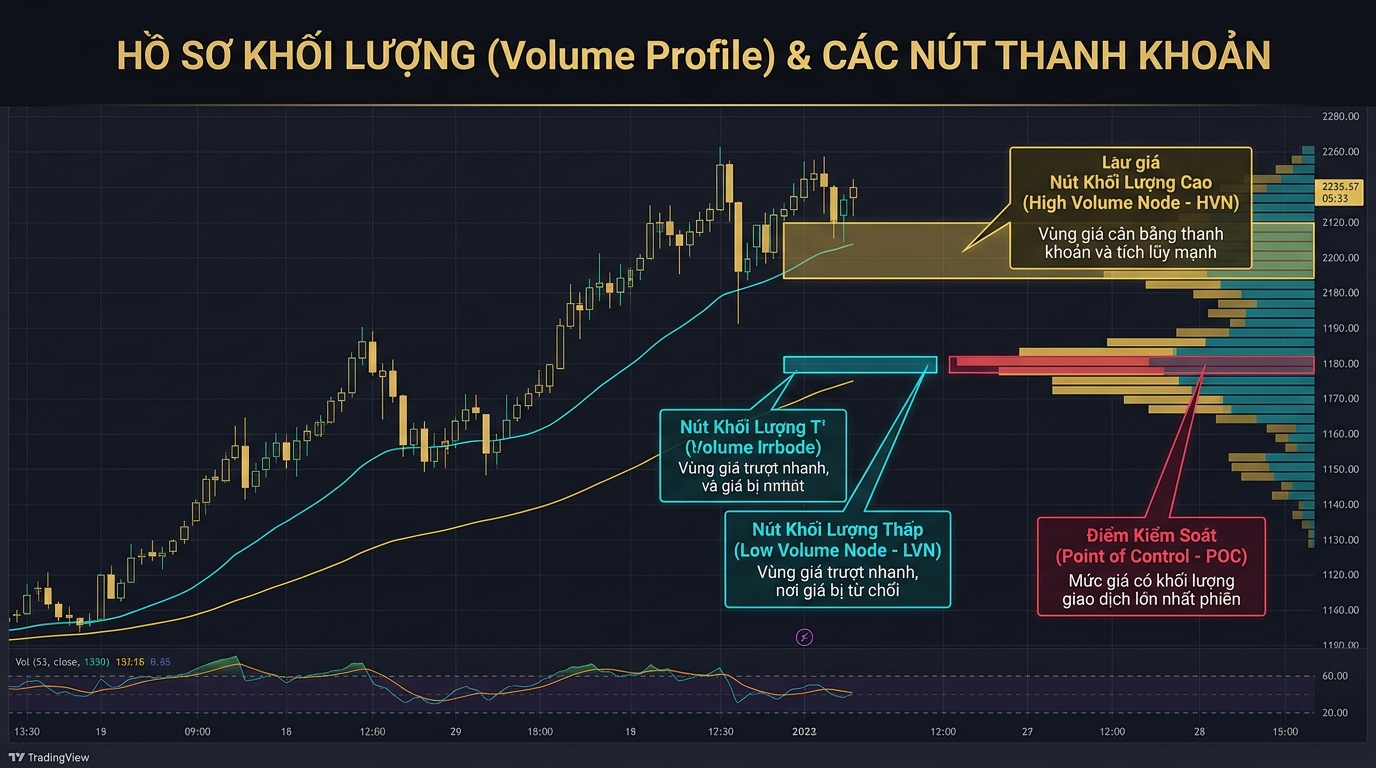
Figure 7: Volume Profile analysis dissects the precise accumulation and distribution footprint of institutional whales on the chart.
Upgrade to a Professional Analytical System
Master structural market reading, decode institutional order flow, and forge unshakable emotional discipline across all market regimes.

Tier 1 Trading Mastery (Foundations)
Master 7 core price action patterns, volume reading methodologies, and build a standardized execution framework.

7 Days Root Frequency Awakening
A transformative journey to purify mental clutter, dissolve fear, and cultivate serene detachment in decision-making.

Thunder Wind Obelisk (Smoky Quartz)
Natural smoky quartz tower absorbing electromagnetic noise, dispersing impulsive reactivity, and anchoring focus.
5. Closing Remarks from Jennie & Key Takeaways Box
Financial markets have always been a place where those with money seek experience, and those with experience capture money. When you only look at price, you see what large capital wants you to see. But when you learn to listen to the language of trading volume, you witness the footprints whales can never conceal.
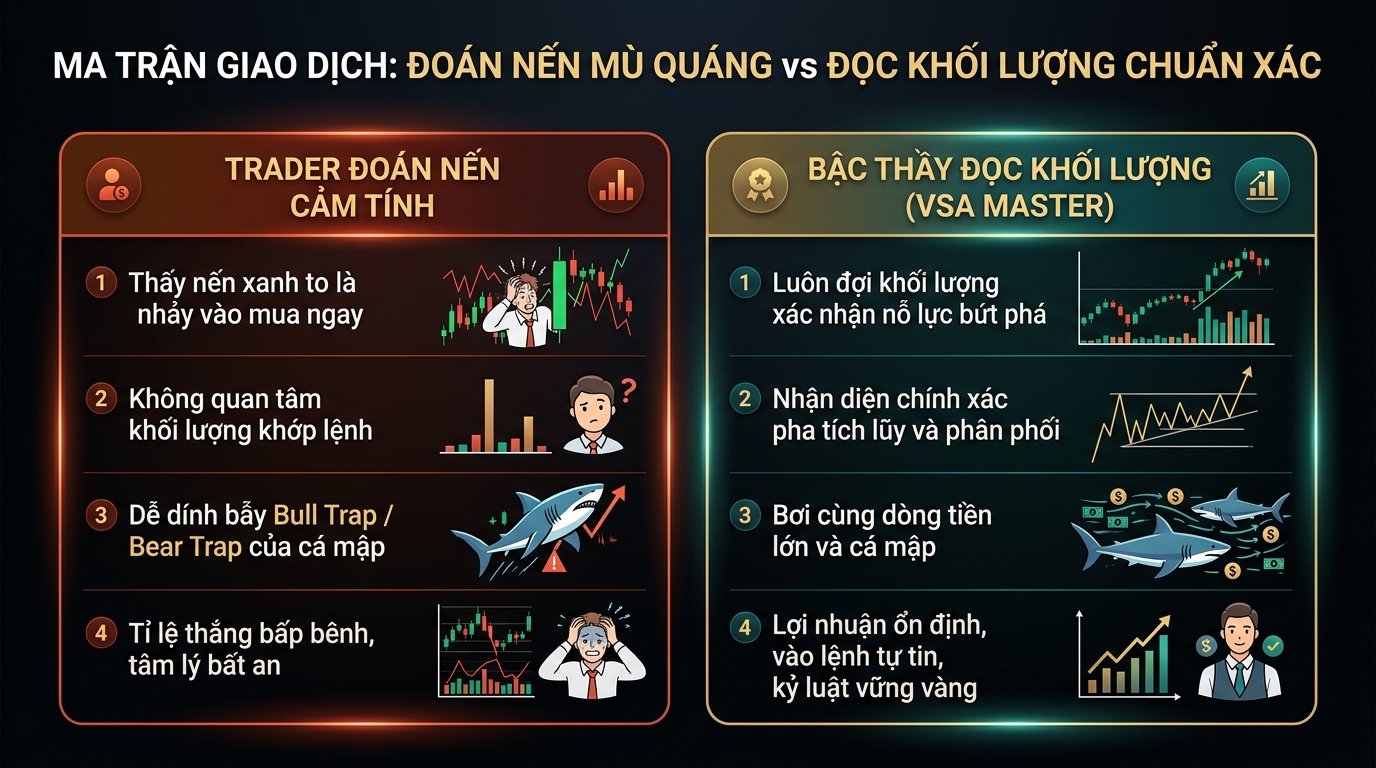
Figure 8: Matrix comparison between emotional retail guesswork and institutional volume analysis.
Always remember: A seductive candlestick lacking volume confirmation is a trap. Exercise patience, stay on the sidelines, and await absolute convergence between Effort and Result before committing your hard-earned capital. That is the distinction between a gambler and an awakened, long-term investor.
KEY TAKEAWAYS
Volume Is the Fuel of Price: Candlestick shape displays outward movement; volume validates the authentic commitment of smart money within.
Master Wyckoff's Law of Effort vs Result: High effort with meager result, or massive price movement on dry volume, both signal impending trend exhaustion and reversal.
Enforce the 5-Step Validation Protocol: Decisive candle close → Volume exceeding 1.5x-2x MA20 → Low-volume retest → Volume Profile node alignment → Multi-timeframe synergy.
Discipline in Every Execution: Never chase a green breakout candle without the solid backing of institutional trading volume.
About the Author: Jennie Uyen Chu
Founder of GEMRAL • Institutional Market Structure & Order Flow Specialist
Jennie Uyen Chu is a professional financial investor with over a decade of live execution experience across international markets. She developed the GEMRAL market analysis framework, integrating price action, order flow analytics, and rigorous capital preservation discipline to empower traders with a durable competitive edge.
ACADEMIC REFERENCES & ORDER FLOW STUDIES
Wyckoff, R. D. (1931). The Richard D. Wyckoff Method of Trading and Investing in Stocks. Wyckoff Associates.Williams, T. (1993). The Undeclared Secrets That Drive the Stock Market. Global Markets Ltd.Coulling, A. (2013). A Complete Guide to Volume Price Analysis. Createspace Independent Publishing Platform.Steidlmayer, J. P., & Hawkins, S. B. (2003). Steidlmayer on Markets: A New Approach to Credible Information. John Wiley & Sons.Kahneman, D., & Tversky, A. (1979). Prospect theory: An analysis of decision under risk. Econometrica, 47(2), 263-291.Lo, A. W., & MacKinlay, A. C. (1999). A Non-Random Walk Down Wall Street. Princeton University Press.Shiller, R. J. (2000). Irrational Exuberance. Princeton University Press.Murphy, J. J. (1999). Technical Analysis of the Financial Markets: A Comprehensive Guide to Trading Methods and Applications. New York Institute of Finance.Nison, S. (1991). Japanese Candlestick Charting Techniques: A Contemporary Guide to the Ancient Investment Techniques of the Far East. Prentice Hall Press.Elder, A. (1993). Trading for a Living: Psychology, Tactics, Money Management. John Wiley & Sons.Dalton, J. F., Jones, E. T., & Dalton, R. B. (2007). Mind Over Markets: Power Trading with Market Generated Information. John Wiley & Sons.Bulkowski, T. N. (2005). Encyclopedia of Chart Patterns. John Wiley & Sons.Fama, E. F. (1970). Efficient capital markets: A survey of theory and empirical work. The Journal of Finance, 25(2), 383-417.Grossman, S. J., & Stiglitz, J. E. (1980). On the impossibility of informationally efficient markets. The American Economic Review, 70(3), 393-408.Hasbrouck, J. (1991). Measuring the information content of stock trades. The Journal of Finance, 46(1), 179-207.Kyle, A. S. (1985). Continuous auctions and informed trader interactions. Econometrica, 53(6), 1315-1335.O'Hara, M. (1995). Market Microstructure Theory. Blackwell Publishers.Biais, B., Hillion, P., & Spatt, C. (1995). An empirical analysis of the limit order book and the order books in the Paris Bourse. The Journal of Finance, 50(5), 1655-1689.Taleb, N. N. (2001). Fooled by Randomness: The Hidden Role of Chance in Life and in the Markets. Texere.Mandelbrot, B., & Hudson, R. L. (2004). The (Mis)Behavior of Markets: A Fractal View of Risk, Ruin, and Reward. Basic Books.